Trends in Suspicious Activity Report Filings in Alabama (1996-2006)
This report analyzes the trends in Suspicious Activity Report (SAR) filings in Alabama from April 1, 1996, to December 31, 2006. A total of 18,032 SARs were reported, with various characterizations of suspicious activities noted. The visualization includes a pie chart showcasing the top nine characterizations, indicating that individual SARs may include multiple characterizations, leading to a figure that exceeds the total number of SARs. Additionally, geographic patterns of SAR filings from January 1, 2006, to December 31, 2006, by zip code are also presented, providing insights into the areas with significant activity.

Trends in Suspicious Activity Report Filings in Alabama (1996-2006)
E N D
Presentation Transcript
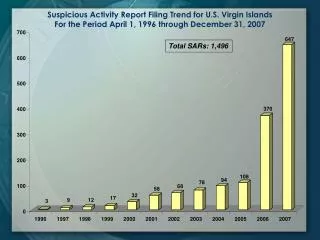
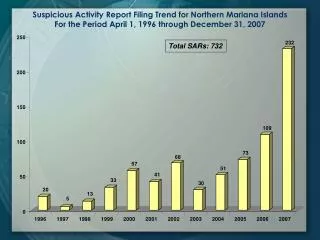
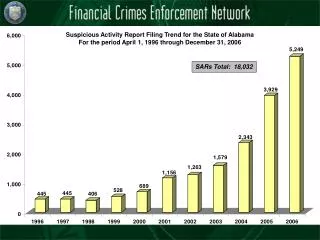
Suspicious Activity Report Filing Trend for the State of AlabamaFor the period April 1, 1996 through December 31, 2006 SARs Total: 18,032
Characterizations of Suspicious Activity for the State of Alabama For the period April 1, 1996 through December 31, 2006 Characterizations of Suspicious Activity Report Filing Trends for the state of Alabama - For the period April 1, 1996 through December 31, 2006 Note: The pie chart represents the top nine characterizations plus additional characterizations in total. An individual SAR may cite more than one characterization. Hence, the number of characterizations detailed here significantly exceeds the total number of SARs.
Suspicious Activity Report Geographic Pattern for the State of Alabama For the period January 1, 2006 through December 31, 2006 SAR Filings by Zip Code Over 50 Between 15 and 50 Between 10 and 15 Between 6 and 10 Less than 6 Note: Statistics based on Filer Branch Address
Suspicious Activity Report Geographic Pattern for the State of Alabama For the period January 1, 2006 through December 31, 2006 SAR Filings by Zip Code Over 50 Between 15 and 50 Between 10 and 15 Between 6 and 10 Less than 6 Note: Statistics based on Filer Branch Address