
Primary Source Analysis
E N D
Presentation Transcript
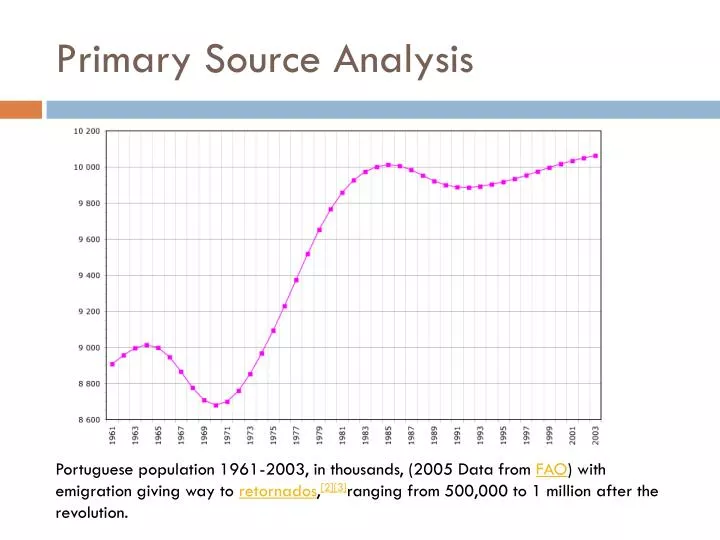
Primary Source Analysis Portuguese population 1961-2003, in thousands, (2005 Data from FAO) with emigration giving way to retornados,[2][3]ranging from 500,000 to 1 million after the revolution.
Decolonization and its impact Mr. Cruz, AC Flora High School
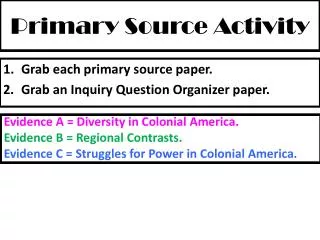
Means to Independence: Armed • Colonies seek independence by force • International support is needed for weapons • Usually lasted longer than negotiated independence • Long lasting issues
Means to Independence: Armed • Angola • 1960’s: Soviet influenced Guerillas fight Portugal • 1974: Portuguese gov’t is overthrown by Portuguese citizens • 1975: New government grants independence to Portuguese imperial possessions
Result: Redistribution of Resources • Retornados: • 300,000 Portuguese leave for Portugal after Independence • Gov’t desires to redistribute abandoned resources, but struggles to figure out: • Who? What? When? Where? How? • Leads to conflict • Angolan Civil War • Communist supported MPLA, eventual winner • USSR and Cuba send resources and troops • Aids the “Spread of Communism”
Result: Transnational Movements • Communism • Pan-Arabism • Pan-Africanism • “African peoples both on the continent and in the Diaspora, share not merely a common history, but a common destiny”
Pan-Africanism • Organization of African Unity / African Union • Achieve greater unity and solidarity between African countries and the peoples of Africa • Defend the sovereignty, territorial integrity and independence of its Member States
Result: Population Resettlement • Redrawing of Colonial boundaries • Imposed boundaries • Ex: India/Pakistan • Religious-based Partition • Hindus persecuted in Pakistan • (20%-1945, 1%-2003) • Muslims persecuted in India • Forced migration
Result: Colonial Subject Migration • Imperial powers view lax migration laws as a form of apology to former colonies • Algeria to France (After 1962) – Evian Accord • Seeking a “Better Life” • Maintain family ties • Fear of internal conflicts in Algeria • French Reaction is negative, but committed to Post-Colonial “Obligations”
Result: Colonial Subject Migration • DO NOT WRITE THIS! • ZinedineZidane • French National Soccer Team Member • Parents were from AguemouneAthSlimane, Algeria 2006 World Cup Final
Regional, Religious, and Ethnic Movements Nigeria Biafra
OIL REVENUE IN NIGERIA (5) The Nigerian central government gains (and gained) a lot of its revenue from oil companies which pay a charge for the petroleum they ship out of Nigeria. This table shows the percentage of total government revenue which comes from these charges on oil. YearPercentage 1958-59 .08 1962-63 7.31 1966-67 18.26 1970-71 25.99 1974-75 80.81 1978-79 66.30 1982-83 67.00 1986-87 75.80 1989-90* 97.24 *Last year of information on the source. [Adapted from data in Eghosa E. Osaghae, Crippled Giant Nigeria Since Independence (Bloomington: Indiana University Press, 1998), p. 20.]
Ethnolinguistic Diversity (6) www.ethnologue.com/statistics/country
Prompt (answer on your own) • How did regional, religious, and ethnic differences challenge the inherited imperial boundaries in Nigeria? • http://www.bbc.co.uk/news/world-africa-20808106