Download
1 / 36
360 likes | 375 Views
This figure illustrates population trends and demographic changes in the United States from 1950 to 2050. It includes data on total population, population aged 65 and over, and population aged 75 and over. Furthermore, it highlights the percentage of population in different age groups, selected race groups, poverty rates by age, low-income population by age, race, and Hispanic origin, health insurance coverage among individuals under 65 years of age, and early prenatal care by race and Hispanic origin of the mother.

E N D
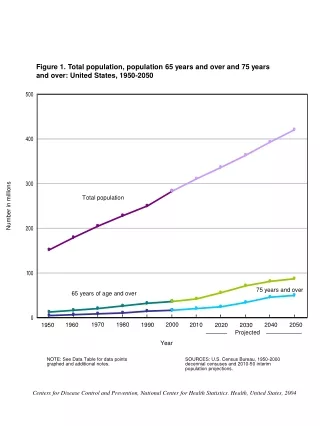
Figure 1. Total population, population 65 years and over and 75 years and over: United States, 1950-2050 Total population Number in millions 75 years and over 65 years of age and over 1970 1980 2000 1990 2010 1960 2040 2050 2020 2030 1950 Projected Year NOTE: See Data Table for data points graphed and additional notes. SOURCES: U.S. Census Bureau, 1950-2000 decennial censuses and 2010-50 interim population projections. Centers for Disease Control and Prevention, National Center for Health Statistics. Health, United States, 2004
Figure 2. Percent of population in 4 age groups: United States, 1950, 2000, and 2050 75+ 75+ 75+ 1950 2000 2050 NOTE: See Data Table for data points graphed and additional notes. SOURCES: U.S. Census Bureau, 1950 and 2000 decennial censuses and 2050 middle series population projections. Centers for Disease Control and Prevention, National Center for Health Statistics. Health, United States, 2004
Hispanic Hispanic Black1 Black1 Asian or Pacific Islander1 Asian or Pacific Islander1 American Indian or Alaska Native1 American Indian or Alaska Native1 2 or more races1 2 or more races1 Percent Percent Figure 3. Percent of population in selected race and Hispanic origin groups by age: United States, 1980-2000 Under 18 years of age 18 years of age and over 1 Not Hispanic NOTES: Persons of Hispanic origin may be of any race. Race data for 2000 are not directly comparable with data from 1980 and 1990. Individuals could report only one race in 1980 and 1990, and more than one race in 2000. Persons who selected only one race in 2000 are shown in single-race categories; persons who selected more than one race in 2000 are shown as having 2 or more races and are not included in single-race categories. In 2000, the category “Asian or Pacific” includes Asian and Native Hawaiian or Other Pacific Islander. See Data Table for data points graphed. SOURCE: U.S. Census Bureau, 1980-2000 decennial censuses. Centers for Disease Control and Prevention, National Center for Health Statistics. Health, United States, 2004
Figure 4. Poverty rates by age: United States, 1966-2002 65 years and over Under 18 years Percent 18-64 years 1966 1970 1975 1980 1985 1990 1995 2002 Year NOTES: Data shown are the percent of persons with family income below the poverty level. See Data Table for data points graphed and additional notes. SOURCE: U.S. Census Bureau, Current Population Survey. Centers for Disease Control and Prevention, National Center for Health Statistics. Health, United States, 2004
Figure 5. Low income population by age, race, and Hispanic origin: United States, 2002 Under 18 years Hispanic Black only Asian only White only, not Hispanic 18-64 years Hispanic Black only Asian only White only, not Hispanic 65 years and over Hispanic Black only Asian only White only, not Hispanic Percent NOTES: Poor is defined as family income less than 100 percent of the poverty level and near poor as 100-199 percent of the poverty level. Persons of Hispanic origin may be of any race. Black and Asian races include persons of Hispanic and non-Hispanic origin. See Data Table for data points graphed and additional notes. SOURCE: U.S. Census Bureau, Current Population Survey. Centers for Disease Control and Prevention, National Center for Health Statistics. Health, United States, 2004
Figure 6. Health insurance coverage among person under 65 years of age: United States, 1984-2002 Private Percent Uninsured Medicaid 1984 1989 1995 1997 1999 2002 Year NOTES: Percents are age adjusted. See Data Table for data points graphed, standard errors, and additional notes. SOURCE: Centers for Disease Control and Prevention, National Center for Health Statistics, National Health Interview Survey. Centers for Disease Control and Prevention, National Center for Health Statistics. Health, United States, 2004
Figure 7. No Health insurance coverage among persons under 65 years of age by selected characteristics: United States, 2002 Age Under 18 years 18-24 years 25-34 years 35-44 years 45-54 years 55-64 years Percent of poverty level Below 100 percent 100-149 percent 150-199 percent 200 percent or more Race and Hispanic origin White only, not Hispanic Asian only Black only, not Hispanic American Indian and Alaska Native only Hispanic (total) Mexican Other Hispanic Cuban Puerto Rican Percent NOTES: Percents by poverty level, Hispanic origin, and race are age adjusted. Persons of Hispanic origin may be of any race. Asian and American Indian and Alaska Native races include persons of Hispanic and non-Hispanic origin. See Data Table for data points graphed, standard errors, and additional notes. SOURCE: Centers for Disease Control and Prevention, National Center for Health Statistics, National Health Interview Survey. Centers for Disease Control and Prevention, National Center for Health Statistics. Health, United States, 2004
Figure 8. Early prenatal care by race and Hispanic origin of mother: United States, 1980-2003 Percent with early care 1995 2002 1985 1980 1990 Year NOTES: Early prenatal care begins during the first trimester of pregnancy. See Data Table for data points graphed, standard errors, and additional notes. SOURCE: Centers for Disease Control and Prevention, National Center for Health Statistics, National Vital Statistics System. Centers for Disease Control and Prevention, National Center for Health Statistics. Health, United States, 2004
Figure 9. Early prenatal care by detailed race and Hispanic origin of mother: United States, 2002 White, not Hispanic Black, not Hispanic Hispanic (total) Cuban Puerto Rican Central and South American Other Hispanic Mexican Asian or Pacific Islander (total) Japanese Chinese Filipino Other Asian or Pacific Islander Hawaiian American Indian or Alaska Native Percent NOTES: Early prenatal care begins during the first trimester of pregnancy. Persons of Hispanic origin may be of any race. The race groups, Asian or Pacific Islander and American Indian or Alaska Native, include persons of Hispanic and non-Hispanic origin. See Data Table for data points graphed and additional notes. SOURCE: Centers for Disease Control and Prevention, National Center for Health Statistics, National Vital Statistics System. Centers for Disease Control and Prevention, National Center for Health Statistics. Health, United States, 2004
Figure 10. Influenza and pneumococcal vaccination among adults 65 years of age and over: United States, 1989-2002 Influenza vaccination during past 12 months Pneumococcal vaccination ever 1991 1989 1995 1993 1997 1999 2002 NOTE: Data are for the civilian noninstitutionalized population and are age adjusted. See Data Table for data points graphed and additional notes. SOURCES: Centers for Disease Control and Prevention, National Center for Health Statistics, National Health Interview Survey. Centers for Disease Control and Prevention, National Center for Health Statistics. Health, United States, 2004 Year
Figure 11. Influenza and pneumococcal vaccination among adults 65 years of age and over by race and Hispanic origin: United States, 2000-2002 Influenza vaccination during the past 12 months White only, not Hispanic Asian only Black only, not Hispanic Hispanic Pneumococcal vaccination ever White only, not Hispanic Asian only Black only, not Hispanic Hispanic Percent NOTES: Data are for the civilian noninstitutionalized population and are age adjusted. Persons of Hispanic origin may be of any race. Asian only race includes persons of Hispanic and non-Hispanic origin. See Data Table for data points graphed and additional notes. SOURCE: Centers for Disease Control and Prevention, National Center for Health Statistics, National Health Interview Survey. Centers for Disease Control and Prevention, National Center for Health Statistics. Health, United States, 2004
Figure 12. Cigarette smoking among men, women, high school students, and mothers during pregnancy: United States, 1965-2003 Men High school students Percent Women Mothers during pregnancy 2003 1990 1965 1970 1985 1995 1975 1980 Year NOTES: Percents for men and women are age adjusted. See Data Table for data points graphed, standard errors, and additional notes. Cigarette smoking is defined as: (for men and women 18 years of age and older) at least 100 cigarettes in lifetime and now smoke every day or some days; (for students in grades 9-12) 1 or more cigarettes in the 30 days preceding the survey; and (for mothers with a live birth) during pregnancy. SOURCES: Centers for Disease Control and Prevention, National Center for Health Statistics, National Health Interview Survey (data for men and women); National Vital Statistics System (data for mothers during pregnancy); National Center for Chronic Disease Prevention and Health Promotion, Youth Risk Behavior Survey (data for high school students). Centers for Disease Control and Prevention, National Center for Health Statistics. Health, United States, 2004
Figure 13. Current cigarette smoking among high school students by sex, frequency, and grade level: United States, 2003 Frequent smoking Male Grade 9 Grade 10 Grade 11 Grade 12 Female Grade 9 Grade 10 Grade 11 Grade 12 Percent NOTES: Current cigarette smoking is defined as having smoked cigarettes on 1 or more days of the 30 days preceding the survey; frequent cigarette smoking is defined as having smoked cigarettes on 20 or more of the 30 days preceding the survey. See Data Table for data points graphed and standard errors. SOURCE: Centers for Disease Control and Prevention, National Center for Chronic Disease Prevention and Health Promotion, Youth Risk Behavior Survey (YRBS). Centers for Disease Control and Prevention, National Center for Health Statistics. Health, United States, 2004
Figure 14. High school students not engaging in recommended amounts of physical activity (neither moderate nor vigorous) by grade and sex: United States, 2003 Male Students Grade 9 Female Students Grade 10 Grade 11 Grade 12 Percent NOTE: See Data Table for data points graphed, standard errors, and additional notes defining moderate and vigorous activity. SOURCE: Centers for Disease Control and Prevention, National Center for Chronic Disease Prevention and Health Promotion, Youth Risk Behavior Survey. Centers for Disease Control and Prevention, National Centers for Health Statistics. Health, United States, 2004
Figure 15. Adults not engaging in leisure-time physical activity by age and sex: United States, 1998-2002 Men 65+ years 45-64 years 18-44 years Women 65+ years 45- 64 years 18-44 years NOTE: See Data Table for data points graphed, standard errors, and additional notes defining leisure-time physical activity. SOURCE: Centers for Disease Control and Prevention, National Center for Health Statistics, National Health Interview Survey. Centers for Disease Control and Prevention, National Center for Health Statistics. Health, United States, 2004
Figure 16. Overweight and obesity by age: United States, 1960-2002 Overweight including obese, 20-74 years Overweight, but not obese, 20-74 years Obese, 20-74 years Overweight, 6-11 years Overweight, 12-19 years 1976-80 1966-70 1999-2002 1963-65 1971-74 1960-62 1988-94 Year SOURCES: Centers for Disease Control and Prevention, National Center for Health Statistics, National Health Examination Survey and National Health and Nutrition Examination Survey. NOTES: Percents for adults are age adjusted. For adults: "overweight including obese" is defined as a body mass index (BMI) greater than or equal to 25, "overweight but not obese" as a BMI greater than 25 but less than 30, and "obese" as a BMI greater than or equal to 30. For children: "overweight" is defined as a BMI at or above the sex- and age-specific 95th percentile BMI cut points from the 2000 CDC Growth Charts: United States. "Obese" is not defined for children. See Data Table for data points graphed, standard errors, and additional notes. Data are for the civilian noninstitutionalized population and are age adjusted. See Data Table for data points graphed and additional notes. Centers for Disease Control and Prevention, National Center for Health Statistics. Health, United States, 2004
Figure 17. Obesity among adults 20-74 years of age by sex, race, and Hispanic origin: United States, 1999-2002 All races Men Women White only, not Hispanic Men Women Black only, not Hispanic Men Women Mexican Men Women Percent NOTES: Percents are age-adjusted. Obese is defined as a body mass index (BMI) greater than or equal to 30. Persons of Mexican origin may be of any race. See Data Table for data points graphed, standard errors, and additional notes. SOURCE: Centers for Disease Control and Prevention, National Center for Health Statistics, National Health and Nutrition Examination Survey. Centers for Disease Control and Prevention, National Center for Health Statistics. Health, United States, 2004
Figure 18. Selected chronic health conditions causing limitation of activity among children by age: United States, 2001-02 Speech Asthma/breathing Mental retardation or other development Other mental, emotional, or behavioral Attention Deficit/Hyperactivity Disorder Learning disability Age SOURCE: Centers for Disease Control and Prevention, National Center for Health Statistics, National Health Interview Survey. NOTES: Children with more than one chronic health condition causing activity limitation are counted in each category. Selected health conditions include the three leading causes of activity limitation among children in each age group. See Data Table for data points graphed, standard errors, and additional notes. Centers for Disease Control and Prevention, National Center for Health Statistics. Health, United States, 2004
Figure 19. Limitation of activity caused by 1 or more chronic health conditions among working-age adults by selected characteristics: United States, 2000-2002 Age 18-44 years 45-54 years 55-64 years Sex Male Female Percent of poverty level Below 100 percent 100-199 percent 200 percent or more Race and Hispanic origin Hispanic White only, not Hispanic Black only, not Hispanic Percent NOTES: Data are for the civilian noninstitutionalized population and are age adjusted. Persons of Hispanic origin may be of any race. See Data Table for data points graphed, standard errors, and additional notes. SOURCE: Centers for Disease Control and Prevention, National Center for Health Statistics, National Health Interview Survey. Centers for Disease Control and Prevention, National Center for Health Statistics. Health, United States, 2004
Figure 20. Selected chronic health conditions causing limitation of activity among working-age adults by age: United States, 2000-2002 Mental Illness Fractures/joint injury Lung Diabetes Heart/other circulatory Arthritis/other musculoskeletal Age NOTES: Persons may report more than one chronic health condition as the cause of their activity limitation. Selected chronic health conditions include the four leading causes of activity limitation among adults in each age group. See Data Table for data points graphed, standard errors, and additional notes. SOURCE: Centers for Disease Control and Prevention, National Center for Health Statistics, National Health Interview Survey. Centers for Disease Control and Prevention, National Center for Health Statistics. Health, United States, 2004
Figure 21. Limitation of activities of daily living among Medicare beneficiaries 65 years and over: United States, 1992-2002 All beneficiaries Noninstitutionalized beneficiaries 1992 1993 1994 1995 1996 1997 1998 1999 2000 2001 2002 Year NOTES: Percent are age adjusted. Limitation of activities of daily living is defined as having difficulty and receiving help or supervision with at least one of the following six activities: bathing or showering, dressing, eating, getting in or out of bed or chairs, walking, and using the toilet. All beneficiaries includes institutionalized and noninstitutionalized beneficiaries. See Data Table for data points graphed, standard errors, and additional notes. SOURCE: Centers for Medicare and Medicaid Services, Medicare Current Beneficiary Survey, Access to Care files. Centers for Disease Control and Prevention, National Center for Health Statistics. Health, United States, 2004
Figure 22. Life expectancy at birth and at 65 years of age by sex: United States, 1901-2001 Females Life Expectancy at birth Males Females Life expectancy at 65 years Males 1901 1910 1920 1930 1940 1960 1970 2001 1950 1980 1990 Year NOTE: See Data Table for data points graphed and additional notes. SOURCE: Centers for Disease Control and Prevention, National Center for Health Statistics, National Vital Statistics System. Centers for Disease Control and Prevention, National Center for Health Statistics. Health, United States, 2004
Figure 23. Infant, neonatal, and postneonatal mortality rates: United States, 1950-2002 Infant mortality rate Neonatal mortality rate Postneonatal mortality rate 1960 1950 1980 1970 2002 1985 1990 1995 Year NOTES: Infant is defined as under 1 of age, neonatal as under 28 days of age, and postneonatal as between 28 days and 1 year of age. See Data Table for data points graphed, and additional notes. SOURCE: Centers for Disease Control and Prevention, National Center for Health Statistics, National Vital Statistics System. Centers for Disease Control and Prevention, National Center for Health Statistics. Health, United States, 2004
Figure 24. Infant mortality rates by detailed race and Hispanic origin of mother: United States, 1999-2001 White, not Hispanic Black, not Hispanic Hispanic (total) Puerto Rican Other Hispanic Mexican Central and South American Cuban Asian or Pacific Islander (total) Hawaiian Filipino Other Asian or Pacific Islander Japanese Chinese American Indian or Alaska Native Infant per 1,000 live births NOTES: Infant is defined as under 1 year of age. Persons of Hispanic origin may be of any race. The race groups, Asian or Pacific Islander and American Indian or Alaska Native, include persons of Hispanic and non-Hispanic origin. See Data Table for data points graphed and additional notes. SOURCE: Centers for Disease Control and Prevention, National Center for Health Statistics, National Linked Birth/Infant Death Data Sets. Centers for Disease Control and Prevention, National Center for Health Statistics. Health, United States, 2004
Figure 25. Death rates for leading causes of death for all ages: United States, 1950-2002 All causes Heart Disease Cancer Stroke Unintentional injuries CLRD 1960 1970 2002 1990 1995 1985 1950 1980 Year NOTES: Rates are age adjusted. Causes of death shown are the five leading causes of death for all ages in 2002. CLRD is chronic lower respiratory diseases. Starting in 1999, data were coded according to ICD-10. See Data Table for data points graphed and additional notes. SOURCE: Centers for Disease Control and Prevention, National Center for Health Statistics, National Vital Statistics System. Centers for Disease Control and Prevention, National Center for Health Statistics. Health, United States, 2004
Figure 26. Percent of persons reporting prescription drug use in the past month by age: United States, 1988-94 and 1999-2000 All ages 3 or more prescribed drugs 1 or 2 prescribed drugs 1988-94 1999-2000 Under 18 years 1988-94 1999-2000 18-44 years 1988-94 1999-2000 45-64 years 1988-94 1999-2000 65 years and over 1988-94 1999-2000 Percent of population NOTE: All ages data are age adjusted. See Data Table for data points graphed, standard errors, and additional notes. SOURCE: Centers for Disease Control and Prevention, National Center for Health Statisics, National Health and Nutrition Examination Survey. Centers for Disease Control and Prevention, National Center for Health Statistics. Health, United States, 2004
Figure 27. Percent of physician office and hospital outpatient department visits with 5 or more drugs prescribed, ordered, or provided by age: United States, 1995-2002 75 years and over 65 to 74 years 45 to 64 years 18 to 44 years Under 18 years Year NOTE: See Data Table for data points graphed, standard errors, and additional notes. SOURCES: Centers for Disease Control and Prevention, National Center for Health Statistics, National Ambulatory Medical Survey and National Hospital Ambulatory Medical Care Survey. Centers for Disease Control and Prevention, National Center for Health Statistics. Health, United States, 2004
Figure 28. Percent of asthma visits with quick-relief and long-term control drugs prescribed, ordered, or provided: United States, 1995-2002 Long-term control (preventive) drug Quick-relief (rescue) drug Year NOTES: Asthma visits are physician office and hospital outpatient department visits for patients with a diagnosis of asthma (ICD-9-CM 493). See Data Table for data points graphed, standard errors, and additional notes. SOURCES: Centers for Disease Control and Prevention, National Center for Health Statistics, National Ambulatory Medical Survey and National Hospital Ambulatory Medical Care Survey. Centers for Disease Control and Prevention, National Center for Health Statistics. Health, United States, 2004
Figure 29. Percent of asthma visits with selected asthma drugs prescribed, ordered, or provided: United States, 1995-2002 Inhaled corticosteroids Oral corticosteroids Long-acting bronchodilators Leukasts Cromolyns1 Year 1Estimates are considered unreliable. Data on cromlyns for 1997-2000 have a relative standard error (RSE) of 20-30 percent. The 2001-02 estimate has an RSE of greater than 30 percent and is not shown. NOTES: Asthma visits are physician office and hospital outpatient department visits for patients with a diagnosis of asthma (ICD-9-CM 493). See Data Table for data points graphed, standard errors, and additional notes. SOURCES: Centers for Disease Control and Prevention, National Center for Health Statistics, National Ambulatory Medical Survey and National Hospital Ambulatory Medical Care Survey. Centers for Disease Control and Prevention, National Center for Health Statistics. Health, United States, 2004
Figure 30. Percent of adults 18 years of age and over reporting antidepressant drug use in the past month by sex and age: United States, 1988-94 and 1999-2000 All Men 1988-94 1999-2000 18-44 years 45-64 years 65 years and over 1988-94 1999-2000 All Women 18-44 years 45-64 years 65 years and over Percent of population NOTE: See Data Table for data points graphed, specific drugs included, standard errors, and additional notes. SOURCE: Centers for Disease Control and Prevention, National Center for Health Statistics, National Health and Nutrition Examination Survey. Centers for Disease Control and Prevention, National Center for Health Statistics. Health, United States, 2004
Figure 31. Percent of adults 18 years of age and over reporting antidepressant drug use in the past month by race and ethnicity: United States, 1988-94 and 1999-2000 SSRI antidepressants All ages Non-SSRI antidepressants 1988-94 1999-2000 White, not Hispanic 1988-94 1999-2000 Mexican or Black, not Hispanic 1988-94 1999-2000 Percent of population NOTES: Data are age age-adjusted. All races includes persons of all races and Hispanic origins, not just those shown separately. Data for adults of Mexican origin and non-Hispanic black adults have been combined due to the small sample size in each of those categories. See Data Table for data points graphed, standard errors, and additional notes. SOURCE: Centers for Disease Control and Prevention, National Center for Health Statistics, National Health and Nutrition Examination Survey. Centers for Disease Control and Prevention, National Center for Health Statistics. Health, United States, 2004
Figure 32. Selective serotonin reuptake inhibitor (SSRI) antidepressant drug visits among adults 18 years of age and over by sex: United States, 1995-2002 Women Men Year NOTES: SSRI antidepressant drug visits are physician office and hospital outpatient department visits with SSRI antidepressant drugs prescribed, ordered, or provided. See Data Table for data points graphed, specific drugs included, standard errors, and additional notes. SOURCES: Centers for Disease Control and Prevention, National Center for Health Statistics, National Ambulatory Medical Survey and National Hospital Ambulatory Medical Care Survey. Centers for Disease Control and Prevention, National Center for Health Statistics. Health, United States, 2004
Figure 33. Stimulant drug visits among children 5-17 years of age by sex: United States, 1994-2002 Boys Girls Year NOTES: Stimulant drug visits are physician office and hospital outpatient department visits with stimulant drugs prescribed, ordered, or provided. See Data Table for data points graphed, specific drugs included, standard errors, and additional notes. SOURCES: Centers for Disease Control and Prevention, National Center for Health Statistics, National Ambulatory Medical Survey and National Hospital Ambulatory Medical Care Survey. Centers for Disease Control and Prevention, National Center for Health Statistics. Health, United States, 2004
Figure 34. Antidepressant drug visits among children 5-17 years of age by sex: United States, 1994-2002 Boys Girls Year NOTES: Antidepressant drug visits are physician office and hospital outpatient department visits with antidepressant drugs prescribed, ordered, or provided. See Data Table for data points graphed, specific drugs included, standard errors, and additional notes. SOURCES: Centers for Disease Control and Prevention, National Center for Health Statistics, National Ambulatory Medical Survey and National Hospital Ambulatory Medical Care Survey. Centers for Disease Control and Prevention, National Center for Health Statistics. Health, United States, 2004
Figure 35. Cholesterol-lowering statin drug visits among adults 45 years of age and over by sex: United States, 1995-2002 Men, 65 years and over Women, 65 years and over Men, 45-64 years Women, 45-64 years Year NOTES: Cholesterol-lowering statin drug visits are physician office and hospital outpatient department visits with cholesterol-lowering statin drugs prescribed, ordered, or provided. See Data Table for data points graphed, specific drugs included, standard errors, and additional notes. SOURCES: Centers for Disease Control and Prevention, National Center for Health Statistics, National Ambulatory Medical Survey and National Hospital Ambulatory Medical Care Survey. Centers for Disease Control and Prevention, National Center for Health Statistics. Health, United States, 2004
Figure 36. Percent of nonsteroidal anti-inflammatory drug (NSAID) visits with COX-2 NSAIDs prescribed, ordered or provided among adults 18 years of age and over by sex: United States, 1999-2002 1999-2000 2001-2002 18-44 years 45-64 years 65-74 years 75 years and over Percent of NSAID visits NOTES: NSAID is nonsteriodal anti-flammatory drug. NSAID visits are physician office and hospital outpatient department visits with NSAIDs prescribed, ordered, or provided. See Data Table for data points graphed, specific drugs included, standard errors, and additional notes. SOURCES: Centers for Disease Control and Prevention, National Center for Health Statistics, National Ambulatory Medical Care Survey and National Hospital Ambulatory Medical Care Survey. Centers for Disease Control and Prevention, National Center for Health Statistics. Health, United States, 2004