Download
1 / 24
240 likes | 395 Views
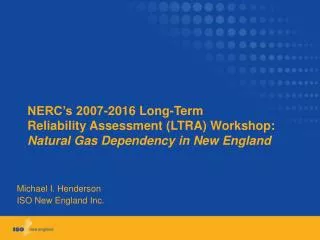
Presentation to FERC’s Northeast Energy Infrastructure Conference Electricity Infrastructure in New England. Stephen G. Whitley Sr. Vice President and Chief Operating Officer ISO New England Inc. January 31, 2002. Overview of Remarks. ISO New England - Who we are and what we do

E N D
Presentation to FERC’s Northeast Energy Infrastructure ConferenceElectricity Infrastructurein New England Stephen G. Whitley Sr. Vice President and Chief Operating Officer ISO New England Inc. January 31, 2002
Overview of Remarks • ISO New England - Who we are and what we do • Supply outlook • Natural gas issues • Regional transmission planning process • Southwest Connecticut • Conclusions
Wholesale Market Who is ISO New Englandand what do we do? • INDEPENDENT system operator based in Holyoke, MA • Private, not-for-profit corporation created according to FERC principles in 1997 • Responsible for system reliability and administration of the wholesale electricity markets and the regional transmission tariff • ISO operates under an agreement with NEPOOL ISOAgreement
Supply Additions Appear Strong in Relationship to Demand Growth Projected CumulativeSummer SupplyAdditions over 1998 MW Cumulative Increase in SummerPeak Demand over 1998
Gas Pipelines Have InsufficientCapacity for Power Plant Use Gas-Fired MW at Risk • Shortfalls in deliveries to electric generation sector could begin as early as this winter. • No impacts to traditional gas LDC operations/customers. • Potential gas contingencies assessed for impacts on electric generation sector. • Dual fuel units switching to oil mitigates any potential delivery shortfalls. 4,000 3,000 MW 2,000 1,000 0 2001/2002 2002/2003 2004/2005 Phase I High Phase II Reference Phase II High
Regional Transmission Expansion Plan (RTEP) • ISO-NE-led effort involving both New England transmission owners and a diverse group of stakeholders • First phase (RTEP01-Oct. ‘01) represents initial assessment of reliability and economics of New England system • Goals of analysis: • Assess system adequacy both regionally and sub-regionally • Identify transmission constraints • Communicate the status of planned transmission upgrades • Estimate costs of congestion to consumers • Attract a market response (generation, transmission, load response)
Transmission Bottlenecks are IncreasingProjected Annual Costs of Congestion RTEP01, 2002-06 High Case $600M Low Case $125M
Priority One: SW ConnecticutTransmission System History and Background • 345 kV loop originally proposed in 1970s postponed due to: • Fluctuations in economy and load growth • 115 kV system improvements • High coordination of local generator and transmission maintenance • Loads increased 25% in 1990s • Sale of existing generators resulted in loss of control of optimum coordination of local generator and transmission maintenance • More uncertainty surrounding future availability and performance of local generation • Cross Sound Cable (Trans-Energie merchant facility) approved by Connecticut Siting Council; 300 MW connection to Long Island
345kV Transmission Proposal Material on this page is consider Non-Internet Public (NIP) You would like a copy of this slide, please contact: Public Reference RoomTelephone: 202-502-8371Toll-free 1-866-208-3676Email: public.referenceroom@ferc.gov
In closing... • Supplies in New England are adequate, however, ‘deliverability’ is at issue • Transmission bottlenecks are increasing the cost anddecreasing the reliability of electricity production and delivery • Natural gas requirements for power generation increasing; current pipeline system cannot supply all power plant requirements on coldest days • Regional transmission planning is key to success of the regional marketplace • Southwest Connecticut requires action NOW
Supply Outlook Generator Construction is Robustas of 1/1/2002, Summer Ratings MW Cuml. • Generation installed in 1999 355 355 • Generation installed in 2000 1,738 2,093 • Generation installed in 2001 1,5703,663 • Expected 2002 & beyond(under construction) 6,120 9,783 • Planned 2002 & beyond(NOT under construction) 1,584 11,367
Gas Study History and Background • Formation of the New England Gas/Electric Discussion Group in 1991 to examine regional coordination issues between the gas & electric industries • Examine operational reliability of the gas/electric infrastructure • Increase coordination between the industries • Educate industry participants and observers • 1993 EPRI report includes the modeling of the loss of a major gas & non-gas fired generator, under projected 1995 system conditions • Seven years pass with no similar analysis
Gas Study Why a Gas Study? • Since 1997, ISO-NE has received applications for interconnection System Impact Studies for almost 55,000 MW of new merchant generation capacity • Virtually all of this newly proposed capacity is advanced combined cycle technology or peaking capacity fueled exclusively by natural gas • There is a need to review the natural gas pipeline infrastructure in New England and its ability to reliably meet the increasing demand of the power generation sector (deliverability study)
Gas Study Scope of Study • Study time frame: 2001 - 2005 • Analysis of existing pipeline infrastructure (Phase I) • Analysis of expected pipeline infrastructure additions (Phase I & II) • Develop a steady state hydraulic engineering model of the pipeline systems serving the NEPOOL region (Phase I & II) • Analyze impacts of Reference and High Case natural gas demand consumption (Phase I & II) • Conduct sensitivity analysis and transient analysis (Phase II) • Summarize results and issue report with recommendations
Gas Study Phase I Steady-State Modeling ResultsIssued February 2001 • No pipeline delivery constraints on a peak day in Winter 2000-01 • No summer peak day pipeline deliverability constraints through 2005 • Gas delivery constraints become apparent in Winter 2003 • Shortfall in gas requirements 1,755 MW out of 7,550 MW assumed • Gas delivery constraints intensify by Winter 2005 • Shortfall in gas requirements 3,226 MW out of 11,500 MW assumed • Theoretical mitigation potential thru back-up fuel: • Winter 2003 - 71 gas-fired units totaling 16,000 MW - 51 dual fueled totaling 9,250 MW • Winter 2005 - 75 gas-fired units totaling 18,650 MW - 54 dual fueled totaling 11,500 MW
RTEP Material on this page is consider Non-Internet Public (NIP) You would like a copy of this slide, please contact: Public Reference RoomTelephone: 202-502-8371Toll-free 1-866-208-3676Email: public.referenceroom@ferc.gov
VT Load 1353879 MW Under Construction RTEP LoadCapacity RTEP Peak Load and Installed Capacity MW by Area - 2006 NB-NE - 700 Phase II - 1500 Highgate - 225 HQ NB Orrington South - 1050 Surowiec South - 1150 ME-NH -1400 ME S-ME BHE Load 11561093 MW Load 5751493 MW Load 376874 MW NH Load 19143590 MW Boston - 3600 East-West - 2150 BOSTON North-South - 2700 Load 52573984 MW NY-NE - 1400w/o Cross Sound Cable W-MA CMA/NEMA Load 20413654 MW Load 1548243 MW NY SEMA/RI - 1600 SEMA RI CT Load 23293346 MW CSC -330 Load 20585419 MW Load 33194359 MW South West CT - 1700 SEMA - 1000 KEY: Connecticut - 2500 NOR Regional Transmission Expansion Plan Sub-area SWCT Load 1129463 MW Load 26622112 MW Priority Studies Required Norwalk-Stamford - 1100 Other Studies Required
SW Connecticut Transmission Alternatives • Various scenarios upgrading 115 kV lines from Frost Bridge, Southington and East Shore • 115 kV Plan • Upgrade Devon to Norwalk 115 kV, Circuit 1 • Upgrade Devon to Norwalk 115 kV Circuit 2 • Upgrade Peaceable to Norwalk 115 kV • Build new Devon to Norwalk 115 kV • Build new Pequonnock to Norwalk 115 kV • Reconfigure Norwalk - Norwalk Harbor - Glenbrook 115 kV System • Case 2 with Plumtree 115 kV Phase Angle Regulator • Case 3 with with Beseck to Devon 345 kV • 230 kV Loop: Plumtree - Norwalk - Beseck
SW Connecticut Long Mountain FrostBridge Proposed‘345 kV Loop’1-Line Southington Plumtree BeseckJunction Devon SWCT Pequonnock Norwalk Key: 115 kV 345 kV Proposed 345 kV NOR-STAM Interface 7
SW Connecticut Recommended Solution: 345-kV Loop • Plumtree - Norwalk - Pequonnock - Devon - Beseck 345kV • 2005 / 2006 in-service date; $500-$600 million • ~100 miles - mostly on existing right-of-way • Includes associated 115kV improvements • Meets study objectives: • Formulate long-term transmission solution for SW Connecticut that: • Satisfies reliability criteria • Eliminates operating difficulties • Eliminates first contingency (including double circuit) overloads • Eliminates threat of voltage collapse • Mitigates congestion by increasing SW CT and Norwalk-Stamford transfer limits
SW Connecticut Improvement Associated With Recommended Solution • Preliminary planning transfer limits • SWCT: > 2,900 MW (up from 1,700) • Norwalk-Stamford: > 1,300 MW (up from 1,100) • May eliminate the need for the Norwalk-Stamford interface definition • Construction sequencing • NU has proposed a phased approach • ISO is currently investigating impacts
SW Connecticut Other Associated Work • Add new 345kV Substations at Plumtree, Norwalk, Pequonnock, Devon, & Beseck Junction • Add new 345kV loop from Plumtree to Beseck Junction • Add (2) 3-150MVA auto transformers at Norwalk, (1) at Pequonnock, and (1) at Devon • Add (1) 3-200 MVA auto transformers at Pequonnock to shift Bridgeport Energy output to 345kV • Rearrange / add to 115kV between Norwalk, Norwalk Harbor and Glenbrook • Establish new 115kV substation adjacent to Devon (East Devon) • Other 115kV work a/w new 345kV structures