Download
1 / 28
280 likes | 364 Views
Interactions between volcanic eruptions and El Ni ñ o: Studies with a coupled atmosphere-ocean model. C. Timmreck, M. Thomas, M. Giorgetta, M. Esch, H.-F. Graf 1 , H. Haak, J. Jungclaus, W. Müller, E. Roeckner , H. Schmidt and G. Stenchikov 2 Max Planck Institute for Meteorology, Hamburg

E N D
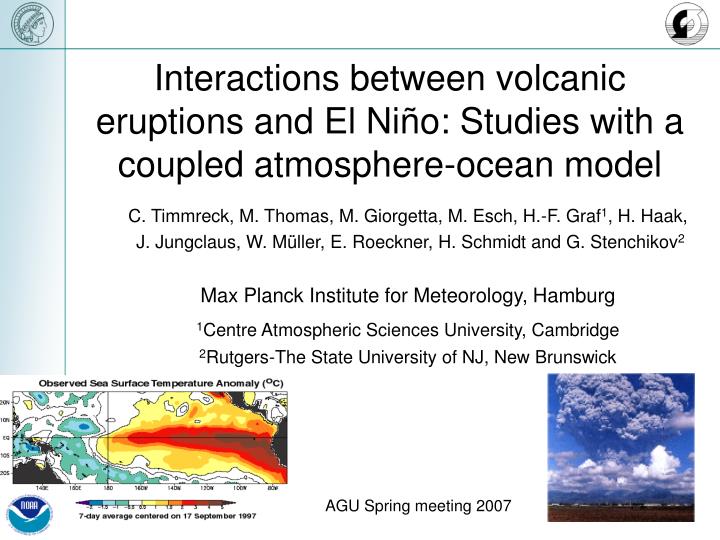
Interactions between volcanic eruptions and El Niño: Studies with a coupled atmosphere-ocean model C. Timmreck, M. Thomas, M. Giorgetta, M. Esch, H.-F. Graf1, H. Haak, J. Jungclaus, W. Müller, E. Roeckner, H. Schmidt and G. Stenchikov2 Max Planck Institute for Meteorology, Hamburg 1Centre Atmospheric Sciences University, Cambridge 2Rutgers-The State University of NJ, New Brunswick AGU Spring meeting 2007
Coupled El Niño Volcanic runs o • The last three biggest eruptions (Agung (1963), El Chichón (1982) and Pinatubo (1991)) occurred at the time as an El Niño event. • Dynamic response due to the combined effects of El Niño and volcanic eruptions are still uncertain. • Paleo reconstructions (Adams et al, 2003) show that large volcanic eruptions enhance the probability of an El Niño event. • AOGCMs are an important tool to improve our understanding of the atmospheric and oceanic response to the combined effects of El Niño and large volcanic eruptions.
Optical depth in the visible Coupled El Niño Volcanic runs • We have carried out a series of volcanic simulations with the AOGCM,ECHAM5/MPIOM. • The volcanic radiative forcing is calculated online in the model. A realistic spatial-temporal distribution of aerosol optical parameters for the Pinatubo episode is used.
Niño 3.4 SST anomalies in ECHAM5/MPIOM The frequency analysis of the El Niño events show good agreement with observations. However, the amplitude of 1.7 K is higher than in the IPCC runs (1.5 K) and in the AMIP cases (1.K)
Niño 3.4 Case I Niño 3.4 Case III Coupled El Niño Volcanic runs Niño 3.4 Case II • Three different cases are selected from a 100 year control run. • 5 ensembles for Jan and June, perturbed / unperturbed. • Each ensemble run has been performed for two years.
Stratospheric temperature response [K] Case I June ERA 40 Reanalysis 30 hPa 50 hPa 100 hPa
Temperature response at 50 hPa Case I January Case I June Case II January Case II June Case III June Case III January
Case II January Case II June GPH Anomaly 50 hPa DJF „91/92“ Case I January Case I June Era 40 Reanalysis
Case II January Case II June 2m temperature anomaly [k] DJF „91/92“ Case I January Case I June Era 40 Reanalysis
Atmospheric response • The stratospheric tropical temperature response is similar for all cases and in agreement with observations. • The dynamical response in the NH high latitudes is highly variable. Only in a few cases the observed pattern is mirrored. However, some ensemble members reflect the observed pattern. • Further analysis (EP fluxes, refractive indices) is necessary • Note: model top at 10 hPa !
Niño 3.4 SST anomalies [k] Case III January Niño 3.4 Case III CTRL June
Niño 3.4 SST anomalies [k] Case II January Niño 3.4 Case II CTRL June
Niño 3.4 SST anomalies [k] Case I January Niño 3.4 Case I CTRL June
U10 [m/s] + 4 + 2 0 - 2 - 4 Ocean T 6 m [K] Ocean T 100 m [K] Hovmoeller diagram of anomalies 5N-5SCase I June
Oceanic response • Large interannual variability can be detected in the tropical dynamical ocean heat response. • Significant ocean response only in two cases: • Case I June where the model is triggered into a La Niña state. Ekman pumping in the mid equatorial Pacific leads to significant cooling in the perturbed model run. • Case II January where radiative effects damp the El Niño signal
Conclusion I • Based on our model results we cannot support the hypothesis from Adams et al.(2003) that volcanic eruptions enhance the possibilty of an El Niño event. • The dynamical response in the atmosphere and in the ocean is highly variable and differs between the selected cases, but also quite strongly between the single ensemble members. • Further analysis is necessary to learn more about the physical mechanisms behind and why the ensemble members behave differently • Ongoing work
Conclusion II We had some questions before we started. Now we have even more. Thank you very much for your attention!
Oceanic response Coupled El Niño Volcanic runs
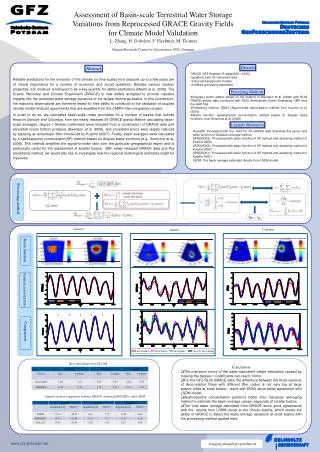
Temperature response in the equatorial Pacific Case I June 199201, 7 months after eruption Ocean depth (m) Ocean depth (m) Temperature differences (K) and respective significances in the equatorial pacific. The grey scale indicates significances of 90, 95, and 99%.
Coupled El Niño Volcanic runs Atmospheric response


![Theoretical [M+H]+ ion m/z](https://cdn1.slideserve.com/3188132/slide1-dt.jpg)