Download
1 / 43
550 likes | 1.83k Views
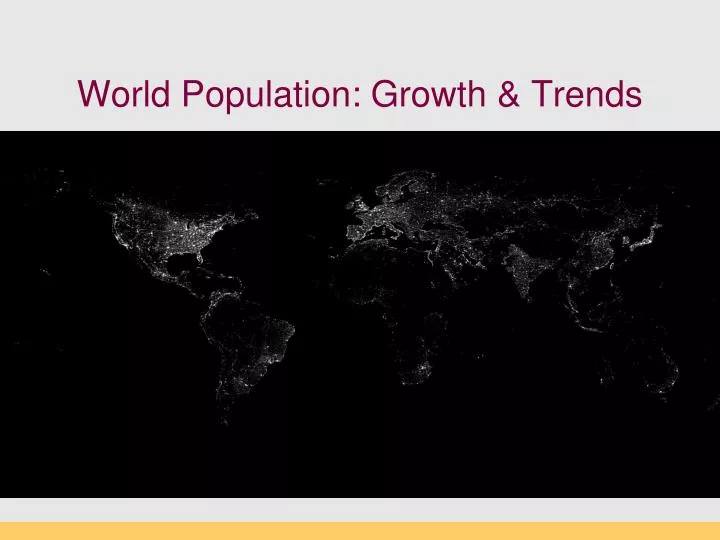
World Population: Growth & Trends. Take away concepts. Why is population growth so central to environmental problems? What is the current population? What will it be in 2050? What factors affect population growth rates? How do growth rate compare in developed vs. developing countries?

E N D
Take away concepts Why is population growth so central to environmental problems? What is the current population? What will it be in 2050? What factors affect population growth rates? How do growth rate compare in developed vs. developing countries? What is a "demographic transition? What are its stages? Interpreting Population Pyramids. Understanding modern demographic trends.
Why Population is so important Thomas Malthus (1798) Organism populations increase exponentially, whereas the “environment” is “fixed” (actually decreases). Factually correct, but a complex problem... Modern example: high populations AND high quality of life
Maltus’ 1st Axiom “The power of population is indefinitely greater than the power in the earth to produce subsistence for man.” “Population, when unchecked, increases in a geometrical ratio (exponentially). Subsistence increases only in an arithmetical ratio (linearly).”
World Population: 7.1 billion As of Sept., 2013 (Super)exponential growth
Some observations... Pre-19th century growth rates were ~0.2%/yr <1 billion people. Pop. doubled in 300yr. 140 million died of plague: 6th, 14th, and 17th centuries. Replaced in a few centuries. Population increased after Renaissance Modern era population explosion: post-1960
More... Population growth after 1800’s ranged 1.2-1.9%! • Super-exponential growth Post-1960 was first time EVER that population doubled within a generation
Toward “logistic growth” Levels off eventually population time
Factors affecting Growth Rate Growth rate = Birth Rate - Death Rate 1.1%=1.9%- 0.8% (as of 2012) Of these the Birth Rate is the most important contributor, specifically the Fertility Rate (#children/woman) Why? Because death rates have stabilized...
Calculating Growth Rates (r) • Nt = Noexp(r t) where No= pop. at time t, Nt = pop at later time (t), and r is the growth rate, and t is time in years. • Rearranging to solve for r: (Nt/No) = exp(r t) r = ln(Nt/No) / t Example: with current population of 7 billion, 1% growth rate = 70 million new people/year. (equiv. to Turkey or Malaysia)
Factors affecting Birth Rate Global BR = 1.9% (95% in developing countries). Lessons on population control from Thailand, South Korea, Japan, India, and China: • Invest in Family Planning • Reduce poverty • Elevate the status of women
Factors affecting Death Rate Global DR = 0.8% (equal between developing and developed countries) Low death rates due to: • medical treatments, • better food supplies and nutrition, • improvements in sanitation, and • access to clean water Lower DR is the main reason for the global population increase
Population Projections Current ~7 billion (and rising), growth rate: 1.1% (and falling…). Projected 2050 population: 9 billion Using modern growth rate: Calculated pop. by 2050: ~11 billion.
Calculating Doubling Times The “Rule of 70”: • Doubling time = 70/percentage growth rate • (… comes from ln(2) = 0.69) Example: • Current growth rate is 1.1%, so doubling time is 70/1.1 = 64 years (ca. 2075). • Projected pop at 2075 would be ~11 billion • But this won’t be the case… why?
Carrying Capacity At the heart of this issue is the concept of Carrying Capacity (K) • the maximum number of individuals that the environmental resources of a given region can support. Population growth and Carrying Capacity co-evolve. • Factors: Technology, social, political, economic institutions, physical & ecological environment.
Carrying Capacity Physical carrying capacity = “packing density”, limited only by space and resources Cultural carrying capacity is always less Still there is a large difference of opinion regarding how many people the earth can support. Accepted range for K is 10-20 billion people
Demographic Transition Refers to the impact of economic development on birth and death rates. Responsible for the gradual reduction in pop growth rates during the late-20th century First noted by demographers for changes in 19th-century Europe, the DT is a critical shift in population growth and age structures that differentiate developed nations from developing nations
Four stages of DT • The Preindustrial Stage when there is little population growth because harse social conditions lead to both high death and high birth rates. • The Transitional Stage, when industrialization begins and health care improves, resulting in lowered death rates, but birth rates remain high. Most of the developing world here. • The Industrial Stage, when the birth rate drops due to modernization (and its accompanying social changes). Many developed countries and a few developing countries here. • Finally, the Postindustrial Stage is recognized by further reductions in birth rates, approaching or even below zero population growth. Approximately 13% of the world population (mostly European countries) is in this stage. A complete DT exhibits both declining birth and death rates
Demographic Transition When is the period of maximum population growth rate?
Demographic Transition Stage 1: Death rates and birth rates both high. Stage 2: Fall in death rates, Population increases. Stage 3. Decline in birth rate stabilizes population. Stage 4. Birth and death rates both low, population stable. Stage 5 (new). Higher death rates than birth rates, populations contract.
Population Pyramid Age Population in age class
2) Transitional Stage 2.9% growth rate; 4.8 births/woman; 43% population under 15 yrs
Why is this group so important? Largest segment of population today.. “bottom billion” - world’s poorest Will be even larger in near future because most of population is under childbearing age (<15 yrs).
Population Momentum (also population lag effect) Phenomenon that population will continue to grow for decades even after total fertility rates equal only the replacement rate... Due to weighting of age structure towards the young… So, work toward zero population growth...
3) Industrial Stage 1.9% growth rate
4) Early Postindustrial 0.1% growth rate; 1.8 births/woman; 18% of population under 15 yrs
4) Late Postindustrial -0.1% growth rate; 1.2 births/woman; 14% population under 15 yrs
Population Pyramids for thefour demographic transition phases
Post-industrial woes of low fertility Fewer young support increasing old Reduced workforce Population decline Significant socioeconomic impacts.
Reducing population growth Successful efforts to reduce population growth by Japan, China, South Korea, Thailand, and Iran. These countries were able to achieve replacement-level fertility (enough children born to replace death of parents) within 15-30 years - this is good news. Key Factors were: • Invest in Family Planning • Reduce poverty • Elevate the status of women
Views from Joel Cohen’s 1995 book“How Many People Can the Earth Support?” • Make a bigger pie: Increase human productive capacities through technology and innovation. • Put fewer forks on the table: Reduce numbers and expectations of people through such means as family planning and vegetarian diets. 3. Teach better manners: Change the terms of people’s interactions through improved planning and government to enhance social justice.
Google’s GapMinder http://tools.google.com/gapminder
Four questions of the UN Population database • Developed vs. developing world • Demographic transitions (1960-2003) • Health or Wealth first for prosperity? • Demographic impact of HIV-AIDS
What should this graph look like for the world in 1950 ? • Positive slope • Negative slope • No significant trend Life expectancy Fertility
What does this graph look like today ? Developed Developing Life expectancy Fertility
Demographic Impact of HIV/AIDS Impact on life expectancy HIV infection rates
UN Millennium Development Goals UN Millennium Declaration, Sept. 2000 Adopted by 189 countries By 2015: • Eradicate extreme poverty & hunger • Universal primary education • Gender equality, empower women • Reduce child mortality • Improve maternal health • Combat HIV/AIDS and other diseases • Environmental sustainability • Global partnership for development