Download

1 / 30
300 likes | 579 Views
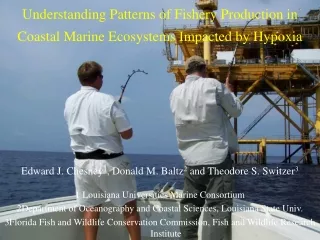
Understanding Patterns of Fishery Production in Coastal Marine Ecosystems Impacted by Hypoxia. Edward J. Chesney 1 , Donald M. Baltz 2 and Theodore S. Switzer 3 1 Louisiana Universities Marine Consortium 2Department of Oceanography and Coastal Sciences, Louisiana State Univ.

E N D
Understanding Patterns of Fishery Production in Coastal Marine Ecosystems Impacted by Hypoxia Edward J. Chesney1, Donald M. Baltz2 and Theodore S. Switzer3 1 Louisiana Universities Marine Consortium 2Department of Oceanography and Coastal Sciences, Louisiana State Univ. 3Florida Fish and Wildlife Conservation Commission, Fish and Wildlife Research Institute
Eutrophic systems are among the most productive marine systems for fishery production • All ecosystems do not respond to eutrophication in the same ways because of differences in the characteristics of the systems. • All species of nekton are not affected to the same degree by environmental impacts in spite of strong overlap in the habitats they occupy.
In terms of ecosystem function what combination of factors dictates vulnerability to eutrophication? • How do those factors compare among large eutrophic marine systems
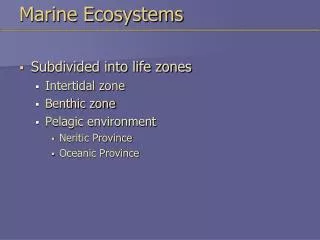
A comparison of Large Marine Ecosystems Impacted by Nutrients
Factor 4 Green Low or no % suboxic (open) Yellow Moderate Red High % suboxic (mostly enclosed) Baltic High Latitude Slow Turn Black Sea Wadden Sea Factor 3 N.Adriatic LIS Chesapeake Seto High Flow Strong perm. Stratification Large nGOM Mobile Low Latitude Fast Turn Factor 2 Delaware Deep Low PP Large Closed Low Flow Weak&seasonal Stratification Small Factor 1 Shallow High PP Small Open Large marine systems impacted by nutrients Large marine systems impacted by nutrients
What species of nekton are most likely to be severely impacted by hypoxia? • Those species with life histories and habitat requirements that chronically affected or have multiple stages of their life history affected increase risks. • Refuges from hypoxia reduce risks at the population level.
Evaluated 52 species of nekton for their potential risks associated with the formation of hypoxia based on their life history characteristics • Principal adult habitat • Estuary, inshore (0-5m), nearshore (5-25m), offshore (25-200m) • Principal nursery habitat • Spawning season • Spawning location • Foraging habits • Benthos, piscivorous, omnivorous • Water column distribution • Demersal, epi-demersal, pelagic, nektonic • Other habitat characteristics • Reef associated, marsh associated
Unraveling the Effects of Hypoxia • In response to hypoxia, nekton may move: • Vertically • Alongshore • Inshore/offshore • Estuary • Inshore (0-5m) • Nearshore (5-25m) • Offshore (25-200m)
Variable Factor 1 Factor 2 Factor 3 Principal Nursery Habitat 0.86174 0.09371 -0.12820 Principal Adult Habitat 0.71291 -0.50409 -0.10680 Foraging Habits 0.68231 -0.02719 0.35962 Spawning Habitat 0.54615 -0.71573 -0.10960 Spawning Season 0.15489 0.87953 -0.15766 Water Column Distribution -0.00666 -0.05685 0.93495 Eigenvalues 2.0386989 1.5526919 1.0681789 % Variance explained 33.98 25.88 17.80 Cumulative % variance explained 33.98 59.86 77.66 PCA of life history characteristics of 52 species of nekton (nGOM)
BA=bay anchovy, GM=gulf menhaden, Ca=sand seatrout, AC=Atlantic croaker, HC=hardhead catfish, S=spot, AB=Atlantic bumper, AT=Atlantic threadfin, FF=fringed flounder, SP=silver perch, C=cutlassfish, LP=least puffer, H=hogchoker, AM=Atlantic moonfish, SK=southern kingfish, LS=lined sole, SF=southern flounder, BT=blackcheek tonguefish, SS=spotted seatrout, SD=star drum, GB=gulf butterfish, SM=Spanish mackerel, Cn=silver seatrout, WS=white shrimp, BS=brown shrimp, BC=blue crab, RS=red snapper, Rc=cobia, KM=king mackerel, RD=red drum, Cf=Atlantic spadefish, BW = bay whiff, Sg=shoal flounder, AS=Atlantic stingray, Da= southern stingray, CR=cownose ray, P=pinfish, SA=striped anchovy, Al=shortfin anchovy, MS=mantis shrimp, Lb= brief squid, Mm=stone crab, Sc=longspined porgy, IL=inshore lizardfish, Ps=shortwing searobin, Pa=harvestfish, BR=blue runner. Demersal Water Column Distribution Summer Estuary Pelagic Spawning Season & Habitat Offshore Winter Offshore Principal Adult & Nursery Habitat Estuary
Coastal species of the nGOM with high risks of being affected by hypoxia
Demersal Water Column Distribution Summer Estuary Pelagic Spawning Season & Habitat Offshore Estuary MS=mantis shrimp SD=star drum BC=blue crab Da= southern stingray AS=Atlantic stingray H=hogchoker BT=blackcheek tonguefish LS=lined sole Mm=stone crab Sg=shoal flounder SP=silver perch BA=bay anchovy, GM=gulf menhaden, Ca=sand seatrout, AC=Atlantic croaker, HC=hardhead catfish, S=spot, AB=Atlantic bumper, AT=Atlantic threadfin, FF=fringed flounder, SP=silver perch, C=cutlassfish, LP=least puffer, H=hogchoker, AM=Atlantic moonfish, SK=southern kingfish, LS=lined sole, SF=southern flounder, BT=blackcheek tonguefish, SS=spotted seatrout, SD=star drum, GB=gulf butterfish, SM=Spanish mackerel, Cn=silver seatrout, WS=white shrimp, BS=brown shrimp, BC=blue crab, RS=red snapper, Rc=cobia, KM=king mackerel, RD=red drum, Cf=Atlantic spadefish, BW = bay whiff, Sg=shoal flounder, AS=Atlantic stingray, Da= southern stingray, CR=cownose ray, P=pinfish, SA=striped anchovy, Al=shortfin anchovy, MS=mantis shrimp, Lb= brief squid, Mm=stone crab, Sc=longspined porgy, IL=inshore lizardfish, Ps=shortwing searobin, Pa=harvestfish, BR=blue runner. Winter Offshore Principal Adult & Nursery Habitat
Coastal species of the nGOM with economic or ecological significance & moderate risks of being affected by hypoxia
Coastal species of the nGOM with economic or ecological significance & lower risks of being affected by hypoxia
How can we fine tune these risks assessments? • Directed studies of species at risks • Additional analyses based upon fisheries data • Modeling
SEAMAP Data Mississippi Louisiana Texas
WLA CLA ETX WTX Hypoxia Subdivided coastal zone • Five alongshore zones:WTX , ETX, WLA, CLA, ELA/MS • Intensity of hypoxia determined by areal extent (Rabalais et al.): • Low (0 – 9,500 km2) • Moderate (9,500 – 16,000 km2) • Severe (16,000 + km2)
Star Drum Source: FishBase (US FWS) • Similar patterns in summer/fall • Abundances highest in inshore WLA waters • Some differences with respect to intensity of hypoxia
Rock Sea Bass Source: FishBase (D. Flescher) • Abundances in nearshore CLA decrease with increasing hypoxia • Abundances in adjacent zones increase with intensity of hypoxia (dependent on season)
De Leiva Moreno et al 2000 • Advocated calculating the ratio of pelagics to demersals as an indicator of system condition in eutrophied coastal systems.
How does this compare to troubled coastal Seas Impacted by Eutrophication? P/D<1.0=Oligotrophic P/D>10=Eutrophic
Pelagic to Demersal Ratio 1950-2004 for the Fertile Crescent nGOM Data Source: NOAA Fisheries Statistics
Conclusions • A simple risk assessment framework might be a useful tool for evaluating relative risks from hypoxia. • Simple metrics to index the condition of the ecosystem may not be adequate because no two ecosystems (nor their fauna) are likely to respond exactly the same to nutrient inputs because of variations among the characteristics of ecosystems.
Acknowledgements • Funding provided by NOAA Coastal Ocean Program • Data: • National Marine Fisheries Service • Louisiana Department of Wildlife and Fisheries • Mississippi Department of Marine Resources • Texas Parks and Wildlife