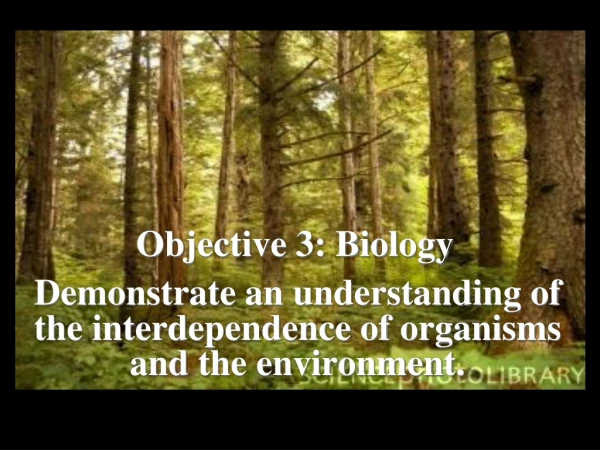
LEVEL 3 BIOLOGY
ECOSYSTEMS. LEVEL 3 BIOLOGY. AN ECOSYSTEM IS…. All the communities and abiotic factors in an environment. COMMUNITIES All the kinds of living things EXAMPLES Water lillies Goldfish Frogs Bacteria Cattails. ABIOTIC FACTORS Conditions or resources EXAMPLES Water Sunlight Oxygen

LEVEL 3 BIOLOGY
E N D
Presentation Transcript
ECOSYSTEMS LEVEL 3 BIOLOGY
AN ECOSYSTEM IS… • All the communities and abiotic factors in an environment.
COMMUNITIES All the kinds of living things EXAMPLES Water lillies Goldfish Frogs Bacteria Cattails ABIOTIC FACTORS Conditions or resources EXAMPLES Water Sunlight Oxygen Nutrients Carbon dioxide AN ECOSYSTEM IS…
“THE LIVING THINGS” POPULATION = a group of organisms of the same species that live in one area
SO HOW DO THESE ORGANISMS GET ENERGY? • PLANTS – PHOTOSYNTHESIZE! • ANIMALS - EAT FOOD! We call plants the producers, or autotrophs and animals the consumers, or heterotrophs. We also classify animals (consumers) as carnivores, herbivores, and omnivores.
PHOTOSYNTHESIS • Plants use carbon dioxide, water, and the sun to make food for themselves – animals take advantage of this and consume plants. • Animals eat plants and produce carbon dioxide and water as wastes.
PHOTOSYNTHESIS Plants Producers or autotrophs Use carbon dioxide & water Make sugar or starch RESPIRATION Animals & Plants Consumers or heterotrophs Use sugar or starch Make carbon dioxide & water IT’S A CYCLE!!!
FOOD CHAINS • A food chain models the flow of energy through organisms in an ecosystem. Secondaryconsumer (Mr. Firman’s biology students) Primary consumer Producer
Levels • Producer which is typically a ____________ • Primary Consumer, also called a ___________ • Secondary Consumer, also called a ________ • Tertiary Consumer • Quaternary Consumer
FOOD WEBS • A food web demonstrates the interconnections between food chains in a community or ecosystem.
Food Web Analysis • What animals are on the highest trophic level? What trophic level is it? • Describe the role of decomposers in the food web; describe where the matter they break down goes. • What happens to the amount of energy available as you go up the food web? Explain!
What do the arrows represent? • What would happen if the owls were removed from this ecosystem? • A resource pulse is an increase in available food; predict what would happen if there was an increase in plant material in this ecosystem.
Matter is recycled How is matter recycled? -Matter moves through food web, from the producers to the consumers -After organism dies, decomposers break down matter to primary nutrients -Cycle starts over again when nutrients are taken up by producers
What is recycled & how is it done? • Carbon (Carbon cycle?) • Nitrogen (Nitrogen cycle?) • Phosphorous (Phosphorous cycle?) • Sulfur (Sulfur cycle?)
CYCLES! NITROGEN CYCLE CARBON CYCLE PHOSPHORUS CYCLE (no gas phase)
What about energy? • Where does the energy come from? • Energy moves through the food chain, from producers to consumers to decomposers BUT it is NOT recycled!!!! • Why not? The “Law of Conservation of Energy” aka “The First Law of Thermodynamics”……
Energy passes through the Trophic Structure of the Ecosystem • What is it? • A pattern of feeding relationships consisting of different levels • The sequence of food transfer up the trophic levels is known as a FOOD CHAIN • Arrows in food chain point FROM the food TO the consumer • Up to 5 trophic levels in a food chain: • Producer; Primary, Secondary, Tertiary, Quaternary Consumers
Where does the energy go? • Mostenergyat each trophic level is used by living things (conduct metabolism, to hunt/kill/consume food, grow, reproduce) • Much is lost as HEAT • Not all living material is consumed (ex: bones, bark, etc.)- these parts are decomposed • So how much energy IS passed on?
The Law of 10% • At each trophic level, 90% of available energy is used, with most of it “lost” as heat to atmosphere. • Only 10% of the energy at each level is available to the next trophic level (when they get EATEN!) • So if a producer has 10,000 Calories (or kilocalories) of energy, how much energy would each level after that have?
Energy Pyramid • At each higher trophic level, the amount of energy decreases by 10%! • Which gets more energy from its prey- primary consumers or tertiary consumers?
ECOLOGICAL PYRAMID • Shows each step in the transfer of energy and matter in a food chain Fill in Trophic Levels: Producer Primary consumer Secondary consumer Tertiary consumer What trophic level is each term below? Herbivore Carnivore Omnivore Scavenger Decomposer
ENERGY PYRAMID • This pyramid represents the energy contained in the biomass.
Revisit: Food Chain/Web Analysis • What animals are on the highest trophic level? What trophic level is it? • Describe the role of decomposers in the food web; describe where the matter they break down goes. • What happens to the amount of energy available as you go up the food web? Explain!
What does this mean for higher level consumers? -There’s less energy in the food they eat! -This means there are FEWER higher level consumers and MORE producers and lower level consumers What happens to an ecosystem if all the producers are killed? (Think deforestation, forest fire, drought, etc)
AN ECOLOGICAL PYRAMID… • Shows the relationships between producers and consumers at all the trophic levels in an ecosystem. Number of organisms energy biomass
BIOMASS PYRAMID • This pyramid represents the amount of biomass found at each trophic level.
NUMERICAL PYRAMID • This pyramid represents the relative number of organisms at each trophic level.
Feeding relationships in an Ecosystem • Predation • Predator (typically a Carnivore) • Prey (may exhibit camouflage) • Herbivore, Scavenger, Decomposer
NON-FEEDING RELATIONSHIPS IN ECOSYSTEMS SYMBIOSIS: • Mutualism – relationship where both organisms benefit • Commensalism - relationship where one organism benefits and the other organism is unaffected • Parasitism – relationship where one organism benefits and the other organism is harmed (sometimes this is a feeding relationship)
After “Rat Attack!” • Draw a food web including the bamboo, black rat, chickens, corn, humans, rice, stink bugs, and anything else that you might notice in the film. • Describe how this ecosystem changes when a “resource pulse” (ex. rapid production of bamboo fruit) occurs. Be sure to describe how this affects all of the various populations that are shown in the video.
Biosphere Organism Cell Tissue Organ Predator Prey Hypothesis Biomass Ecological pyramid Food web Autotroph Producer Heterotroph Consumer Food chain Trophic level Herbivore Carnivore Scavenger Decomposer 10% rule BINGO!!!