Download
1 / 96
1.12k likes | 1.79k Views
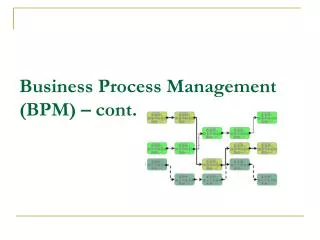
Business Process Management (BPM) – cont. Process Modelling Quality. Most process analysis and design efforts require the use of models to describe what is happening during the process Useful to have some standards and measures of quality as it relates to process modeling

E N D
Process Modelling Quality • Most process analysis and design efforts require the use of models to describe what is happening during the process • Useful to have some standards and measures of quality as it relates to process modeling • Quality of model defined by its accuracy, amount of detail and completeness
Requirements of a Process Model • Business environment • Organisational structure • Business rules • Process structure
Model Validation and Simulation • Useful or necessary to validate the model throughsimulation • Validate the model through simulation is to compare simulated outputs to real-world results
Modelling Perspectives • Processes can be modelled from manyperspectives • All perspectives are maintained in a process repository
Modelling Approaches • Bottom-up • Top-down • Middle-out
Capturing Information for Process Modelling • Direct Observation • Interviews • Survey/Written Feedback • Structured Workshops • Web-Based Conferencing
Modelling Participants • Business strategists • Business managers • Financial analysts • Auditors • Compliance analysts • Process performance analysts • Requirements analysts • Systems analysts • Business analysts
Modelling Techniques and Tools • White Boarding and Flip Charts • Paper and Post-Its • Drawing Tools and Reports (e.g. Visio, PowerPoint) • Electronic Modelling and Projection: • Repository-based tools allow the reuse of objects orpatterns that have already been defined in previous efforts
Process Simulation • Form of models which provide valuable insight to process dynamics • Simulations require sufficient data which typically allows the processto be mathematically simulated under various scenarios, loads, etc. • Simulations can be manual or electronic using process simulationtools • Various benefits
Purpose of Process Analysis • Process analysis is an essential tool to show how well thebusiness is meeting its objectives • Due to business change the processes of an organisationcan quickly become inconsistent to their original designand no longer meet the needs of the business • Analysis generates an understanding and measurement of processeffectiveness and its efficiency • Information generated from analysis includes: • Strategy, culture and environment of the organisation that uses the process (why the processexists) • Inputs and outputs of the process • Stakeholders, both internal and external, including suppliers, customers and their needs andexpectations • Inefficiencies within the current process • Scalability of the process to meet customer demands • Business rules that control the process and why they must exist • What performance metrics should monitor the process, who is interested in those metrics andwhat they mean • What activities make up the process and their dependencies across departments and businessfunctions • Improved resource utilisation • Opportunities to reduce constraints and increase capacity
When to Perform Process Analysis • Can be the result of continuous monitoring of processes orcan be triggered by specific events, such as: • Strategic Planning • Performance Issues • New Technologies • Startup Venture • Merger/Acquisition • Regulatory Requirements
Process Analysis Roles • Performed by a single individual or by across-functional team • Analyst • Decide the depth and scope of the analysis • How it is analysed • Perform the analysis • Provide documentation and final reports to the stakeholders and executive leadership • Facilitator • Lead process analysis teams with an unbiased view • Subject Matter Experts • Individuals closest to the process with knowledge and expertise • Familiar with both the business and technical infrastructure that supports theprocess
Preparing the Analysis • Choose the process • Determine the scope of the depth of analysis • Choose analytical frameworks
Process Design Principles (1) Design around customer interactions Design around value-adding activities Minimise/ automate handoffs Work is performed where it makes the most sense Provide a single point of contact Ensure a continuous flow Reduce batch size: batching causes wait time for items at the end of the batch Capture information once at the source and share it: eliminate data redundancy Involve as few as possible Redesign, then automate Ensure quality at the beginning
Process Design Principles (2) • Standardise processes: when there is no standardisation there cannot be process control • Use co-located or networked teams for complex issues • If complex problems occur regularly, consider co-locatingteam members • If co-location does not make sense, then network the teamso information can smoothly flow • Consider outsourcing business processes • Compare to the costs of designing the process in-house aswell as compared to the risks associated with outsourcing • Process Compliance • Process Design Considerations
Key Process Performance Definitions • All processes have a metric ormeasurement associated with the workor output of the process that isperformed • Metrics are based on the followingfundamental metric dimensions: time, cost, capacity, quality • When a process is value-added? • When it is required to generate the output required by the customer of theprocess • When the customer is willing to pay for the process • When it enhances customer experience
Measurement Methods • Several common measurement methodologies used inBPM implementations • Value Stream Mapping • Activity Based Costing (ABC) • Statistical Methods
BPM Improvement Methodologies An approach with principles, procedures and practices that provide guidelines for designing and executing the different components within BPM
Other Methodologies • Lean: • originated by Toyota • Focuson reduction of process wastes • TQM (Total Quality Management) • focus on process measurement and controls as a megans ofcontinuous improvement • statistical analysis • Performance Improvement Model • developed in the early1990s • framework aligns processes at three distinct three levelsof performance: organisational, process and job/ performer • Redesign • although it may lead to significant changes, these changescontinue to be based on the fundamental concepts of theexisting process • Reengineering • Mike Hammer’s 1993 book Reengineering the Corporation • radical change of process
Activity Specification • Each implementation activity specification should include: • Objectives, performance metrics and list of deliverables—all related todelivering improved customer value • Risks for completion and how to be minimised • Accountability for completion • Financial, personnel, any IT support and other resources required • Length of time for completion • Any implementation task cross-functional interdependencies
What is good quality? • Please list 3 characteristics of a good quality car.
What is a “good quality” mobile phone? • List 3 characteristics of a good quality phone. • How about the characteristics of a process to make a phone?
Definition of Quality • IEEE (IEEE_Std_610.12-1990) : • the degree to which a system, component, or process meets specified requirements/ customer or user needs or expectations • Fault (according to ISO/CD 10303-226): • “an abnormal condition or defect at the component, equipment, or sub-system level which may lead to a failure” • Failure: • the state or condition of not meeting a desirable or intended objective • Defect: • see fault
Root Cause Analysis (RCA) • RCA is used to find the root causes of defects – what is the cause of the failure • RCA can be done using a number of methods: • Barrier analysis • Causal factor tree analysis • Change analysis • Failure mode and effects analysis • Fault tree analysis • 5 Whys • Ishikawa diagram • Pareto analysis
5 Whys: Example • Problem Statement: You are on your way home from work and your car stops in the middle of the road. 1. Why did your car stop? - Because it ran out of gas. 2. Why did it run out of gas? - Because I didn't buy any gas on my way to work. 3. Why didn't you buy any gas this morning? - Because I didn't have any money. 4. Why didn't you have any money? - Because I lost it all last night in a poker game. 5. Why did you lose your money in last night's poker game? - Because I'm not very good at "bluffing" when I don't have a good hand.
Ishikawa Diagram: Principles • Causes are grouped into categories and linked together (primary and secondary causes) • The list of categories is not definite, the figure shows the “typical” • Relationships are used to backtrack the cause of a particular problem. • The analysis requires more effort than 5 whys but still no statistics is necessary.