Conjoint Analysis and Q-Sort: Methods for Market Research and Preferences Analysis
This document outlines the methodologies of Conjoint Analysis and Q-Sorting, which are statistical techniques used to evaluate consumer preferences and make informed marketing decisions. Conjoint Analysis helps determine the most influential attributes of products or services based on respondents’ ratings. Q-Sorting provides a systematic way to examine human subjectivity regarding various ideas. Both methods assist in strategizing and understanding market demands through data collection, regression analysis, and qualitative assessments.

Conjoint Analysis and Q-Sort: Methods for Market Research and Preferences Analysis
E N D
Presentation Transcript
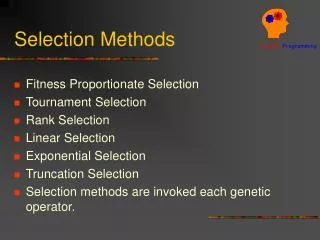
Selection Methods Rev: Nov, 2013 Euiho (David) Suh, Ph.D. POSTECH Strategic Management of Information and Technology Laboratory (POSMIT: http://posmit.postech.ac.kr) Dept. of Industrial & Management EngineeringPOSTECH
Conjoint Analysis A1 A1 A2 A2 A1 A2 Step 1 Decide the important attributes and their levels Step 2 B1 B1 B1 B2 B2 B2 Construct the product’s profile Step 3 Collect the data (e.g., individuals rate each in terms of desirability or rank them) Step 4 Estimate the partial value using multiple regression Step 5 Apply the result to strategies (e.g., forecast market share of each product based on estimated coefficients) • What is Conjoint Analysis? • Statistical technique used in market research to determine how people value different features that make up an individual product or service • The objective of conjoint analysis • To Determine what combination of attributes is the most influential on respondents’ utilities • How to use Conjoint Analysis
Conjoint Analysis – Example (1/2) • Organizing a Package tour product • Step 1: Decide the important attributes and their levels • Extract important factors through survey • Place: Southeast Asia, Australia, Guam • Price: 1.5 million won, 1.8 million won, 2.0 million won • Value added tax: Include, Exclude • Step 2: Construct the product’s profile • Make all possible conjoint profiles • Use fractional factorial design to reduce the number of profiles 3 X 3 X 2 X (1/2) = 9 Profiles • Profile 1: Guam, 2.0 million won, included VATProfile 2: Southeast Asia, 1.8 million won, included VATProfile 3: Guam, 1.5 million won, included VATProfile 4: Southeast Asia, 2.0 million won, excluded VATProfile 5: Australia, 2.0 million won, included VATProfile 6: Guam, 1.8 million won, excluded VATProfile 7: Australia, 1.8 million won, included VATProfile 8: Australia, 1.5 million won, excluded VATProfile 9: Southeast Asia, 1.5 million won, included VAT
Conjoint Analysis – Example (2/2) • Step 3: Collect the data • Let individuals rank the profile • Step 4: Estimate the partial value using multiple regression • Use statistic package software to estimate importanceof each factors (e.g. SPSS) • The most important attribute: Place • The most preferred place: Guam • Step 5: Apply the result to strategies
Q-Sort (1/2) • 2nd. Q-Sorting • Filling the blanks of the distribution-box with Q-Samples • 3rd. Analysis • Understanding the preferences for the ideas Agree(+4) Neutral(0) Disagree(-4) • What is Q-Sort? • Method that offers you systematic and quantitative means for examining human subjectivity • Method that gives you insight into understanding consensus or disagreement on ideas among your group • Key factor • 1st. Q-samples • Statements or ideas which are needed to be ranked • statements or ideas which are needed to be ranked
Q-Sort (2/2) Design Q-sort model Identify a topic 2. Make Q-samples to represent the spectrum of opinions on a given topic 3. Select response distribution (e.g., -4 ~ +4 or -5 ~ +5) Execute Q-sort Categorize each statement into three groups (disagreement, neutrality, and agreement) Place statements to the distribution: The higher degree of agreement of statement, the more the statement is placed at right Analyze the result Analyze correlations between respondents Group statements - 1st. Calculate factor loadings about each factor - 2nd. Classify respondents into factors by checking the factor loadings Analyze normalized factor score to find significant statements • How to use Q-Sort
Q-Sort – Example (1/2) • Step 1: Design Q-sort model • Topic: Ability ph.D in MIS must have • Q-samples: Table 1 • Response distribution • Step 2: Execute Q-sort • Categorize each statement into three groups(disagreement, neutrality, and agreement) • place each statement tothe distribution model(Agree Right, Disagree Left) • e.g.
Q-Sort – Example (2/2) • Step 3: Analyze the result • Analyze correlations between respondents • Classify respondents by calculating factor loadings • Calculate normalized score for each type of respondents • Identify characteristics of responses from a certain type(Check the absolute value of the normalized score)
DEA Step 1 Utilize some variable to establish the efficiency frontier Step 2 Define the efficiency frontier Step 3 A numerical coefficient is given to each firm, defining its relative efficiency • What is Data Envelopment Analysis (DEA)? • Linear programming methodology to measure the efficiency of multiple decision-making units (DMU) when the production process presents a structure of multiple inputs and outputs • Nonparametric method in operations research and economics for the estimation of production frontiers • Advantages of DEA • No need to explicitly specify a mathematical form for the production function • Proven to be useful in uncovering relationships that remain hidden for other methodologies • Capable of handling multiple inputs and outputs • Capable of being used with any input-output measurement • The sources of inefficiency can be analyzed and quantified for every evaluated unit • How to use DEA
DEA – Example Required x2 to makeone y product Efficiency Frontiers Required x1 to makeone y product • A, B, C, D, E: Companies producing product y with raw material x1 and x2 • Efficiency of A and D: 1 • Relative efficiency of B, C, E: 0.82, 0.78, 0.75 respectively (Excessive input of x1 and x2) • B: Benchmarking A • C: Benchmarking A and D with weights 0.64 and 0.36 respectively
Brainstorming Step 1 Find a comfortable meeting environment, and set it up ready for the brainstorming Step 2 Appoint one person to record the ideas. These should be noted in a format than everyone can see and refer to. Depending on the approach you want to use, you may want to record ideas on flip charts, whiteboards, or computers with data projectors Step 3 If people aren’t already used to working together, consider using an appropriate warm-up exercies Step 4 Define the problem you want solved clearly, and lay out any criteria to be met. Make it clear that the objective of the meeting is to generate as many ideas as possible Step 5 Give people plenty of time on their own at the start of the session to generate as many ideas as possible Step 6 Ask people to give their ideas, making sure that you give everyone a fair opportunity to contribute Step 7 • What is brainstorming? • Group creativity technique by which efforts are made to find a conclusion for a specific problem by gathering a list of ideas spontaneously contributed by its members • How to use Brainstorming In a long brainstorming, take plenty of breaks so that people can continue to concentrate
Brainstorming – Example Colab KJ method • Colab • Computer-supported conference systemby Xerox’s Palo Alto Research Center(PARC) • “Bordnoter” : an electronic blackboard • “Cognoter” : brainstorming, organizing, evaluating information • “Argnoter”: presenting, arguing, and evaluating ideas • Design principle: information sharing,“WYSIWIS” (What you see is what I see) • KJ method • Card-based knowledge-creation technique • Computerization of the KJ method • Prototype example: workstation-based GrIPS by Fujitsu • Divergent thinking phase:pick up data such as key words, phrases, picturesfrom Keyword Associater/Picture Library put into “cards” on the “Shared Board” • Convergent thinking phase:Using “Card Editor”, organize the cards into pieces of information, related into a diagram using “D-ABDUCTOR” • Communicate through “Miniature meeting Room”
Delphi Method Define the problem Give everyone the problem Identifying the problem(s) in various forms from a questionnaire to a broad and open question Collate the response Recruiting experts to the Delphi group, sending the problem(s) to everyone in the group and asking them to respond Give everyone the collation Taking the responses that experts send back and collating these into a single anonymous list or sets of lists Repeat as necessary Sending the collation back out to everyone with request to score each item on a given scale (typically 1 to 5) and may allow them to add further items or comments Act on the findings Repeating the rounding until a certain stopping condition meets(Number of iterations, a specific level of agreement) Analyzing the findings and putting plans in place to deal with future risks and opportunities in the project • What is Delphi Method? • Communication technique based on a structured process for collecting and synthesizing knowledge from a group of experts by means of a series of questionnaires accompanied by controlled opinion feedback • Key characteristics • Structuring of information flow • Regular feedback • Anonymity of the participants • How to use Delphi Method
Delphi Method – Example (1/2) • Example • Choosing the next strategy for the company with 5 experts (Stopping Condition: 3 rounds) • 1st round (Questionnaire & Scoring result) • 2ndround (Questionnaire & Scoring result)
Delphi Method – Example (2/2) • Example • Choosing the next strategy for the company with 5 experts (Stopping Condition: 3 rounds) • 3rdround (Questionnaire & Scoring result) The company choose “Organizing a task force team” strategy
Majority voting • What is Majority Voting? • Adecision rule that selects alternatives which have a majority, that is, more than half the votes • Advantage • Being able to produce a prompt and clear decision • Limitation • Disregarding the basic rights of the minority • Properties of Majority Voting • Fairness • Anonymity • The decision rule treats each voter identically • When using majority rule, it makes no difference who casts a vote; indeed the voter's identity need not even be known. • Neutrality • The decision rule treats each alternative equally • Decisiveness • The decision rule selects a unique winner. • Monotonicity • The decision rule would always, if a voter were to change a preference, select the alternative that the voter preferred, if that alternative would have won before the change in preference. Similarly, the decision rule would never, if a voter were to change a preference, select a candidate the voter did not prefer, if that alternative would not have won before the change in preference
Majority voting – Example Should the university set curfew for students living in the dormitory? The statement will be rejected,but the opinion of the one who agreed to the statement will be ignored
AHP Step 1 Goal 1.00 Defining policy issues and establishing policy-making members Step 2 Constructing the hierarchy layer structure of the problems Criterion 1 0.75 Criterion 2 0.25 Step 3 Conducting questionnaire surveys and expert preference integration Step 4 Establishing pair-wise comparison matrices SubC 1 0.15 SubC 2 0.2 SubC 3 0.4 SubC 3 0.1 SubC 3 0.15 Step 5 Conducting consistency test Step 6 Selecting the most optimal option Hierarchy layer structure • What is AHP(Analytic Hierarchy Process)? • A modeling structure for representing multicriteria (multiple goals, multiple objectives) problems – with sets of criteria and alternatives (choices) – commonly found in business environments • Benefits • Helping capture both subjective and objective evaluation measures • Providing a useful mechanism for checking the consistency of the evaluation measures and alternatives suggested by the team • How to use AHP
AHP – Example Step 1 • Issue: Which car is the best car for you? Defining policy issues and establishing policy-making members Choice of a Car Constructing the hierarchy layer structure of the problems Step 2 Function Level (FL) Price Level (PL) Safety Level (SL) Design Level (DL) Step 3 Conducting questionnaire surveys and expert preference integration(1-9 scale preference questionnaire) Establishing pair-wise comparison matrices ( if i≠j; if i=j) (Weight: normalization of geometric means of each row; ∑Weight = 1) Step 4 Step 5 • FL>PL, PL>SL, FL>SL → Consistency • FL>PL, PL>SL, SL>FL→ Inconsistency Conducting consistency test Selecting the most optimal optionby comparing each alternative’s weighted sum of criteria values Step 6 Example
Financial Options vs. Real Options • What is Real Options? • How to valuate Real Options Financial Options Real Options • The right, but not the obligation, to undertake certain business initiatives • To reduce uncertainty of future planes • An instrument that conveys the right,but not the obligation, to engage in a future transaction with fixed price • E.g.) Call option, Put option Expand Real Options Valuation (ROV) Black–Scholes • A suite of option pricing tools to quantify the embedded strategic value for a range of proposed or existing investment scenarios • Mathematical model of a financial market containing certain derivative investment instruments • To calculate “future option value” using stock price, volatility, risk free interest Prepare a number of scenarios Put plan into action immediately One of the scenario happen • What is Financial Options? • How to valuate Financial Options
Financial Options – Example Use the call option Give up the put option Give up the call option Use the put option • Call option • Right to buy certain stocks at the fixed strike price in the future • In-the-money: Future price > Strike price • Use the call option if the difference is bigger than the price of the call option • At-the-money: Future price =Strike price • Out-of-the-money: Future price < Strike price • Put option • Right to sell certain stocks at the fixed strike pricein the future • In the money: Future price < Strike price • Use the put option if the difference is bigger thanthe price of the put option • At-the-money: Future price = Strike price • Out-of-the-money: Future price < Strike price
Real Option – Example (1/3) • Real Option Valuation (ROV) in Mining Industry • Factors: mineral commodity price (major), uncertainty of size of the orebody, proper timing for exploration, cut-off grade, development of the mine Uncertainty will increase the risk of investment Estimate the project by ROV • Value of operating mine • V = V (S, Q, t, j, φ)
Real Option – Example (2/3) • Real Option Valuation (ROV) in Mining Industry (Cont’d) • Free Cash Flow to the Firm (FCFF) • Cash that a company is able to generate after laying out the money required to maintain or expand its asset base
Real Option – Example (3/3) • Real Option Valuation (ROV) in Mining Industry (Cont’d) • Discounted Cash flow Method (DCF) • Method of valuing a project, company, or asset using the concepts of the time value of money • All future cash flows are estimated and discounted to give their present values (PVs) – the sum of all future cash flows, both incoming and outgoing, is the net present value (NPV), which is taken as the value or price of the cash flows in question • ROV • It is more appropriate than DCF to deal with changing price of commodity by considering closing mine permanently, temporary and reopen case
Majority Voting Delphi Method Brainstorming Real Options Conjoint Analysis Q-Sort AHP DEA Financial Options Alternative Selection Methods
Discounted Cash Flow (DCF) • Commonly used quantitative methods include discounted cash flow methods and real options. • Discounted Cash Flow (DCF) • Net Present Value (NPV): Expected cash inflows are discounted and compared to outlays.
Discounted Cash Flow (DCF) Cont’d • Internal Rate of Return (IRR): The discount rate that makes the net present value of investment zero. • Calculators and computers perform by trial and error. • Potential for multiple IRR if cash flows vary • Strengths and Weaknesses of DCF Methods: • Strengths • Provide concrete financial estimates • Explicitly consider timing of investment and time value of money • Weaknesses • May be deceptive; only as accurate as original estimates of cash flows. • May fail to capture strategic importance of project
Real Options Real Options: Applies stock option model to nonfinancial resource investments. E.g.,with respect to R&D: The cost of the R&D program can be considered the price of a call option. The cost of future investment required to capitalize on the R&D program (such as the cost of commercializing a new technology that is developed) can be considered the exercise price. The returns to the R&D investment are analogous to the value of a stock purchased with a call option.
The Aggregate Project Planning Framework • The Aggregate Project Planning Framework • Managers map their R&D projects according to levels of risk, resource commitment and timing of cash flows