
PARP-1 Modulates HIF-2α Accumulation and EPO Expression in Immortalized MEFs Under Hypoxia
This study investigates the role of PARP-1 in the regulation of HIF-2α accumulation and EPO mRNA expression under hypoxic conditions in immortalized mouse embryonic fibroblasts (MEFs). Immunofluorescence analysis reveals that hypoxia-induced nuclear HIF-2α accumulation is diminished in PARP-1 knockout MEFs compared to wild-type cells. Additionally, the silencing efficacy of siRNAs targeting PARP-1, HIF-1α, and HIF-2α was validated using western blotting. EPO mRNA levels were quantified via Q-PCR, demonstrating significant differences between genotypes under hypoxia, with statistical significance noted.

PARP-1 Modulates HIF-2α Accumulation and EPO Expression in Immortalized MEFs Under Hypoxia
E N D
Presentation Transcript
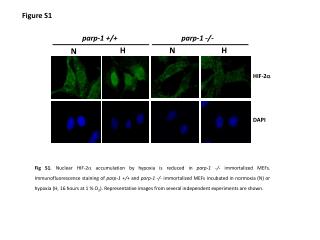
Figure S1 parp-1 +/+ parp-1 -/- H N H N HIF-2 DAPI Fig S1. Nuclear HIF-2 accumulation by hypoxia is reduced in parp-1 -/- immortalizedMEFs.Immunofluorescence staining of parp-1 +/+ and parp-1 -/- immortalized MEFs incubated in normoxia (N) or hypoxia (H, 16 hours at 1 % O2). Representative images from several independent experiments are shown.
Figure S2 H H PARP-1 HIF-1α Control HIF-2α Control Control siRNA: siRNA: siRNA: HIF-1α HIF-2α PARP-1 β-Actin β-Actin β-Actin Figure S2. Validation of silencing efficacy: siRNA of PARP-1, HIF-2 or HIF-1. (Cells were transfected with the correspondig siRNAs and 48h later, the expression levels of the targeted protein was evaluated by WB. HIF expression was analyzed after 16 hours of exposure to hypoxia (1% O2).
Figure S3 parp-1+/+ 75 15 15 Liver Kidney Brain parp-1-/- 50 10 10 Epo mRNA expression (fold induction) N N N H H H * 25 5 5 ** 0 0 0 Figure S3. EPO mRNA levels were determined by Q-PCR from liver, kidney and brain . The level of mRNA in each sample was expressed as fold of the value in control wild-type mice. Numeric value represents mean of hypoxic induction in each genotype at 8 hours, respectively. (*) and (**) indicate p< 0.05 and p<0.001, with respect to wild-type mice.