Download

1 / 57
580 likes | 743 Views
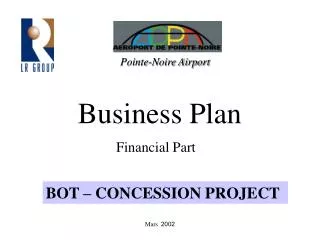
Financial Part. Pointe-Noire Airport. Business Plan. BOT – CONCESSION PROJECT. Business Plan - Table of Content. Executive Summary (English & French) Initial Investments Development Costs Revenues Operational Expenses Annual Profits Cash Flow ROI Appendixes.

E N D
Financial Part Pointe-Noire Airport Business Plan BOT – CONCESSION PROJECT Mars 2002
Business Plan - Table of Content • Executive Summary (English & French) • Initial Investments • Development Costs • Revenues • Operational Expenses • Annual Profits • Cash Flow • ROI • Appendixes
Executive Summary - English • The Congolese Government has decided along with LR Group to Modernize the Pointe-Noire International Airport and has signed a contract • This Modernization of the Airport will contribute to the development of: • The Town of Pointe-Noire and the Kouilou Region • Congolese National Exchanges and Particularly the Pointe-Noire / Brazzaville Relationships • International Relationships with African Countries as well as Europe, Latin America and the United Stats • The Airport Runway is Now Extended in Order to Receive Long Courier as the Airbus 330 • 2.600 X 45 meter plus 2 X 100 m, a Second Taxiway and a Supplementary Aircraft Parking Area of 15.000 m² • The works are executed by LR Group and will be finished in 2002 • Financed by the Congolese government
Executive Summary – English (2) • The BOT / Concession Principles: • A company has been Established – ADP-N • Shareholdings: • Congolese Government: 22% • Private Investors: 78% • Congolese Partners 26% • International Partners 52% • Construction of New International Terminal (6.200m²), Cargo Terminal, Zone Development • Improving Old Terminal, Contribution to Expropriation • Operating of the Airport by ADP-N for more than 18 Years • Contribution for Secondary Airports Development: • 5% of Revenues < 2 Billions FCFA • 7% of Revenues > 2 Billions FCFA
Executive Summary – English (3) • Pointe-Noire Airport Activities (in 2000) • Movements 22.028 • Passengers 357.511 • Cargo (Tons) 63.314 • Initial Investment 19,950,000 USD • Development Costs 500,000 USD / Year • Net Revenues* 3,055,940 USD • Expenses* 2,400,000 USD • Net Profits(*)(**) 511 633 USD • * 1st Year • ** Available for Investors
Executive Summary – English (4)Cash Flow Assumptions • Pessimistic Scenario • Net Profit 1st Year: 500,000 USD • Growth : 10% first 3 Years; 4.5% Afterwards • Interest Rate: 4.75% • Medium Scenario • Net Profit 1st Year: 1,000,000 USD • Growth : 20% first 3 Years; 6.5% Afterwards • Interest Rate: 6.75% • Optimistic Scenario • Net Profit 1st Year: 1,000,000 USD • Growth : 25% first 3 Years; 6.5% Afterwards • Interest Rate: 8.75%
Executive Summary – English (5)Return on Investment (ROI) • Pessimistic Scenario • Impossible to Achieve • Medium Scenario • Achieve after 19 Years • Optimistic Scenario • Achieve after 17 Years
Executive Summary - French • Le Gouvernement Congolaise a Décidé avec le Groupe LR de Moderniser l’Aéroport International de Pointe-Noire et un Contrat a été Signé • La Modernisation de PNR Contribuera aux développement de: • La Ville de Pointe-Noire et la Région de Kouilou • Échanges Nationaux et Particulièrement les relations Pointe-Noire / Brazzaville • Échanges Internationaux avec l’Afrique, l’Europe, l’Amérique Latine et les États Unis • La Piste de l’Aéroport est Actuellement Élargie, Allongé et Renforcé afin de Recevoir des Avions Long Courier comme l’Airbus 330 • 2.600 X 45 mètres plus 2 X 100 m, Une Deuxième Bretelle et Une Extension du Parking Avion de 15.000 m² • Le Travaux sont Exécuté par le Groupe LR et seront terminés en 2002 • Le Travaux sont Financés par le Gouvernement Congolaise
Executive Summary – French (2) • Le Principes du BOT / Concession: • Une Compagnie a été crée – ADP-N • Actionnaires: • Gouvernement Congolaise : 22% • Investisseurs Privés: 78% • Partenaires Congolais 26% • Partenaires Internationaux 52% • Construction d’Un Aérogare Internationale (6.200m²), Terminal Fret , Développement de la Zone • Amélioration de l’Ancien Aérogare, Expropriation • Gestion de l’Aéroport Pendant Plus de 18 Ans • Contribution pour le Développement des Aéroports Secondaires: • 5% des Revenues < 2 Billions FCFA • 7% des Revenues > 2 Billions FCFA
Executive Summary – French (3) • Activités de l’Aéroport de Pointe-Noire (en 2000) • Mouvements 22.028 • Passagers 357.511 • Fret (Tons) 63.314 • Investissement Initial 19.950.000 USD • Coûts de Développement 500.000 USD / An • Revenues Net * 3,055.940 USD • Dépenses 2.400.000 USD • BénéficesNet (*)(**) 511 633 USD • * 1ère Année • ** Disponible pour les Investisseurs
Executive Summary – French (4)Hypotheses pour le Cash Flow • Scénario Pessimiste • Bénéfice Net 1ère Année: 500.000 USD • Croissance: 10% Premières 3 Ans; 4.5% par la Suite • Taux d’Internet: 4.75% • Scénario Moyen • Bénéfice Net 1ère Année: 1.000.000 USD • Croissance: 20% Premières 3 Ans; 6.5% par la Suite • Taux d’Internet: 6.75% • Scénario Optimiste • Bénéfice Net 1ère Année: 1.000.000 USD • Croissance: 25% Premières 3 Ans; 6.5% par la Suite • Taux d’Internet: 8.75%
Executive Summary – French (5)Retour sur Investissement (ROI) • Scénario Pessimiste • Impossibilité d’Amortire • Scénario Moyen • ROI en 19 Ans • Scénario Optimiste • ROI en 17 Ans
ADP-NShareholdings • Congolese Government: 22% • Private Investors: 78% • Congolese Partners: 26% • International Partners: 52%
Initial Investments • Following Study by LR Group in cooperation with Congo: • Concept, Researches, Experts, … • Meetings with Government Officials, Investors, Airlines … • The Initial Scope of the Investment is: • New International Terminal (6200 m2) • Zone Development • Improving Old Terminal • Cargo Terminal • Expropriation
Development CostsStarting Year n+1 • Developments of: • Trade Free Zones • Aircraft Maintenance Area • Cargo Areas and Shops • Land Side Commerce • Access roads in the Airport • Airport Environment • Systems: • Advanced Telecommunication systems • Back-up Power Supply • Additional Buildings • Catering (Aircraft Services), Offices, Commerce, Etc. Total: $0.5M / Year (Up to 20% of Net Profit)
Revenues - Table of Content • Airlines Operating in Pointe-Noire • Historical Traffic Statistics • Landings • Passengers (National, Regional, Int’l) • Cargo (National, Regional, Int’l) • The Revenues Sources • Annual Income/Revenues
CONPANY TYPE OF A/C DESTINATION Air Afrique 737/300; 727/100,200 International Trans Air Benin 737/300 International Lina Congo 737/300, 727/100, 200 Antonov 11 International / national Air Gabon 737/300 International Angola Airlines 737/300 International Aero Service 727/100 International Trance Air Congo 727/200 Naional Air Espace 737/300 National Air Atlantis 727/100 National Airlines Operating in PNRin 2000 Sources: Experts Mission to PNR October. 2000
Historical StatisticsLandings – Year 2000 MOTW/TON TYPE/AC NO OF LANDING PER WEEK TYPE OF MOVMT 3 Cesna 402, BN 20 1 National 5 Cesna 404 6 National 8 Kaza 12 (Fernch Army)) 12 National 22 Antonov 24 54 National 90% Int'l 10% 54 B 737/200 25 30%National 70% Int'l 61 Antonov 12 cargo 14 National 64 Antonov 11 6 Int'l 69 B 737/300 6 Int'l 79 B 727/100 18 National 96 B 727/200 20 National Total Landing 162 per week of which 137 national presenting 85% of total landing and 25 international – 15% Sources: Experts Mission to PNR October. 2000
PAX PAX Variation % Repartition In % Company 1999 2000 1999/2000 1999 2000 Lina Congo 0 12,027 0 0 16.6 Trans Air Congo 24,234 35,531 46.6 49.3 49.0 Aero Service 8,710 22,335 156.4 17.7 30.8 Air Espace 5,295 1,066 (80 - ) 10.8 1.5 Equaflight 10,427 0 (100 - ) 21.2 0 Others 488 1,544 216.4 1.0 2.1 Total 49,154 72, 503 47.5 100 100 Historical Statistics – PassengersNational Traffic 1999/2000 1st Quarter (Jan. to March) Sources: Experts Mission to PNR October. 2000
PAX PAX %Variation Repartition %In Company 1999 2000 1999/2000 1999 2000 Lina Congo 0 6,512 0 0 10.5 Trans Air Congo 36,626 40,281 10.0 66.0 65.0 Aero Service 10,482 12,712 21.03 18.09 20.5 Air Espace 4,566 0 100 - 8.2 0 Equaflight 3,675 0 100 - 6.6 0 Air Atlatis 0 1,564 0 0 205 Others 161 856 431.7 0.3 104 Total 55,512 61,925 11.6 100 100 Historical Statistics – Passengers National Traffic 1999/2000 2nd Quarter (April. to June) Sources: Experts Mission to PNR October. 2000
PAX PAX %Variation Repartition %In Company 1999 2000 1999/2000 1999 2000 Lina Congo 0 17,709 0 0 17.5 Trans Air Congo 51,649 54,073 4.7 69.8 53.04 Air Espace 19,985 19,485 (2.50- ) 27.0 19.02 Equaflight 2,277 0 (- 100) 3.1 0 Air Atlatis 0 5 0 0 0 Others 73 10,079 13,706.8 0.1 9.9 Total 73,984 10,1351 37.0 100 100 Historical Statistics – Passengers National Traffic 1999/2000 3rd Quarter (July to Sep.) Sources: Experts Mission to PNR October. 2000
Historical Statistics – Passengers (National Traffic)1999 / 2000 (Per Year) • Total National Passengers in 1999* : • 238,200 Passengers (in & out) • Total National Passengers in 2000* : • 314,373 Passengers (in & out) • * 4th Quarter = average of 3 quarters Sources: Experts Mission to PNR October. 2000
PAX PAX %Variation Repartition %In Company 1999 2000 1999/2000 1999 2000 Air Gabon 250 183 (26.8-) 28.2 22.2 Angola Air 58 51 (12.1-) 6.6 6.2 Lina Congo 2 59 2850.0 0.2 7.2 Aero Service 242 194 (19.8-) 27.3 23.5 Others 333 337 1.2 37.6- 40.9 Total 885 824 6.9 100 100 Historical Statistics – Passengers (Regional Traffic)1st Quarter 1999/2000 Sources: Experts Mission to PNR October. 2000
PAX PAX %Variation Repartition In Company 1999 2000 1999/2000 1999 2000 Air Gabon 8,873 7,731 (-12.9) 82.5 70.5 Angola Air 1,400 1,932 38.0 13.0 17.6 Lina Congo 0 740 0 0 6.7 Aero Service 347 539 55.3 3.2 4.9 Others 129 26 (-79.8) 1.2 0.2 Total 10,749 10,968 2.04 100 100 Historical Statistics – Passengers (Regional)2nd Quarter 1999/2000 Sources: Experts Mission to PNR October. 2000
Company PAX. PAX Variation % Repartition In % 1999 2000 2000/1999 1999 2000 Air Gabon 9,338 7,280 (-22) 80.0 61.7 Angola Air 1838 1192 (-35.1) 15.7 10.1 Lina Congo 0 2395 0 0 20.3 Aero Service 426 627 47.2 3.6 5.3 Other 70 303 332.9 0.6 2.6 Total 11,672 11,797 1.07 100 100 Historical Statistics – Passengers (Regional Traffic)3rd Quarter Sources: Experts Mission to PNR October. 2000
Historical Statistics – Passengers (Regional Traffic)1999 / 2000 (Per Year) • Total Regional Passengers in 1999* : • 31.074 Passengers (in & out) • Total Regional Passengers in 2000* : • 31.461 Passengers (in & out) • * 4th Quarter = average of 3 quarters Sources: Experts Mission to PNR October. 2000
PAX PAX PAX PAX PAX PAX %Variation %Variation Repartition Repartition Repartition Variation % In % %In %In Company Company 1999 1999 2000 2000 1999/2000 1999/2000 1999 1999 2000 2000 Company 1999 2000 1999/2000 1999 2000 Air Afrique Air Afrique 8686 6271 3984 3983 (54.1-) (37.0-) 100 100 100 100 Air Afrique 8749 6248 (28.6-) 100 75.4 Total Total 6271 8686 3984 3983 (37.0-) (54.1-) 100 100 100 100 Lina Congo 0 1144 0 0 13.8 Trans Air Benin 0 899 0 0 10.8 Total 8749 8291 (5.2-) 100 100 Historical Statistics – Passengers (International)By Quarters 1999/2000 1st Quarter 2nd Quarter 3rd Quarter Sources: Experts Mission to PNR October. 2000
Historical Statistics – Passengers (International) 1999/2000 (Per Year) • Total International Passengers in 1999* : • 31.608 Passengers (in & out) • Total International Passengers in 2000* : • 11.677 Passengers (in & out) • * 4th Quarter = average of 3 quarters Sources: Experts Mission to PNR October. 2000
Type 1999 2000 VARIATION % 2000/1999 Movements 18,450 22,028 19.3 Passengers 300,882 357,511 18.8 Fret (Tons) 71,394 63,306 (8.60- ) Poste (Tons) 8 Historical StatisticsTotal 1999 / 2000 (Per Year) Movements, Passengers, Cargo Sources: Experts Mission to PNR October. 2000
Annual RevenueFirst year of Operation • The estimated revenue in the first year of operation include: • The actual level of activity • combine with • New commercial development by LR Group • The estimation is done on the bases of statistical data from year 2000.
Annual Revenue Sources– First YearEstimation* • F CFA • Revenues from Passenger Taxes Fees • Passenger Departure (National): 157.186 X 3..500 F CFA…….. 550.151.000 • Passenger Departure (International): 21.569 X 12.400 F CFA…. 267.455.600 • Revenues from Landing Fees • National Landings according to average of 54 MTOW Tones • 85% of 22.028 Movements: 2 X 67.210 F CFA…………………. 629.213.299 • International Landings according to average of 54 MTOW Tones • 15% of 22.028 Monuments: 2 X 80.330 F CFA………………….. 132.713.193 • Cargo Fees • 63.306.000 X 20 F CFA…………1.266.120.000 • Consequence of Train Renewal Operations (60% of above)…. 759.672.000 • Aircraft Parking Fees • 22.028 Movements: 2 X 1.5h above 2 first hours X 22 X 120 F CFA 43.615.440 • Gasoline Passage Fees • 22.028 movements: 2 X 5.000 galloons X 1.36 F CFA………….. 74.895.200 * Based on 2000 statistics Sources: Experts Mission to PNR October. 2000
Annual Revenue – First YearEstimation* • Total Fees Revenues: 2.458.715.732 F CFA • Total Commercial Revenues: 12.720.000 F CFA • Total in USD: 3.251.000 * Based on 2000 statistics Sources: Experts Mission to PNR October. 2000
Movements, Passengers, Aircrafts Reports Terminals Recruitment & Training Airport Services Fees Pilots Debriefings Budgetary Control Central Garage Statistics Department Organization & Administration Suppliers’ Payments Airport Fees Meteorological Debriefings Airlines Billing Buildings & Warehouses Licenses Department Commercial Revenues Salaries’ Payments Airport Fees Salary Department Transport Department Maintenance Division Air Traffic Division Human Resources Division Accounting Division Collection Division Meteorological Division A. Ambetos Mrs. Mouluki Mrs. Ngokouba Mrs. Y. Ntaloulou Mr. Benjamin Airport Director F. Tsimba Operational ExpensesOrganization Chart
Operational Expenses Monthly Summary Expenses • Salaries (BOT Conditions) 75.000 USD • 75 Congolese Employees • Social security, Medical care, Social Allocations • Services & Sub-Contractors 80.000 USD • Electricity, Water, Telecommunication • Airport Services • Management Expenses 25.000 USD • Consumables & Small Investments 20.000 USD Annual Summary Expenses 2.400.000 USD
Annual Profit – 1st Year • Assumptions (BOT Conditions) • Congo Government Part 22% • Contribution for Secondary Airports Development 5% from Income < 2 Billions F CFA 7% from Income > 2 Billions F CFA • Average: 6% • Gross Revenues 3.251.000 USD • Net Revenues 3.251.000 X 94%3.055.940 USD • Expenses 2.400.000 USD • Profits 3.055.940 – 2.400.000 655.940 USD • Net Profits* 655.940 X 78% 511 633.200 USD * Available for Investors
Cash Flow • Assumptions • Revenues Increases • New Runway 2600m / 45m + Tarmac & TW (Summer 2002) • LR Group Management Experience • Expenses Control • Profits Sharing • Pessimistic Scenario • Medium Scenario • Optimistic Scenario
Cash Flow – Pessimistic ScenarioAssumptions • LR investment in BOT contract grew from 15 M USD to 19,75 M USD due to the increase of the terminal from 3.000 M2 to 6.200 M2. • There were major changes from the original 1999 forecast: • a) International traffic goes now to Brazzaville and already now traffic is 54% less than 1999 • b) Train line Pointe Noire- Brazzaville will dramatically reduce Cargo traffic. • Net Profit is calculated after payment of "concession fees" in any form to Congo. • 4.5% is the International general aviation rate of growth • 10% rate of growth for 3 years upon operating the new Terminal and the extended runway. • 8.75% is the best finance rate that can be achieved for investments in Africa without any risk premium. Nevertheless, we are applying 4.75%. • Any additional investment will require extension of the concession period in order to recover it.
Cash Flow – Medium ScenarioAssumptions • LR investment in BOT contract grew from 15 M USD to 19,75M USD due to the increase of the terminal from 3.000 M2 to 6.200 M2. • Although there were major changes from the original 1999 forecast, we believe that with LR management the level of the nominal income of 1999 will be kept as a basis for 2000 and onwards. • Net Profit is calculated after payment of "concession fees" in any form to Congo. • LR management will achieve a higher rate of growth than the international aviation rate. • 20% rate of growth for 3 years upon operating the new Terminal and the extended runway. • 8.75% is the best finance rate that can be achieved for investments in Africa without any risk premium. Nevertheless, we are applying 6.75%. • Any additional investment will require extension of the concession period in order to recover it.
Cash Flow – Optimistic ScenarioAssumptions • LR investment in BOT contract grew from 15 M USD to 19,75 M USD due to the increase of the terminal from 3.000 M2 to 6.200 M2. • Although there were major changes from the original 1999 forecast, we believe that with LR management the level of the nominal income of 1999 will be kept as a basis for 2000 and onwards. • Net Profit is calculated after payment of "concession fees" in any form to Congo. • LR management will achieve a higher rate of growth than the international aviation rate. • 25% rate of growth for 3 years upon operating the new Terminal and the extended runway. • 8.75% is the best finance rate that can be achieved for investments in Africa without any risk premium. • Any additional investment will require extension of the concession period in order to recover it.
ROI • As Seen in the Cash Flow Tables and Chart, The Break Even Period is: • Pessimistic Scenario.……. >> Years • Medium Scenario……………. 19 Years • Optimistic Scenario………….. 17 Years
Company Movements Movements Variation % Repartition In % 2000 2001 2001/2000 2000 2001 Air Afrique 234 227 -6.58 100 57.3 Trans Air Benin 0 102 100 26.4 Lina Congo 0 63 16.3 Total 243 392 61.31 100 100 Appendix 1Historical Statistics2000/2001 International Movements 1st Semester
Company Movements Movements Variation % Repartition In % 2000 2001 2001/2000 2000 2001 Air Gabon 427 504 18.03 25 19.5 Angola Air (TAAG) 111 192 72.97 6.5 7.4 Lina Congo 183 11 -93.98 10.7 0.4 Aero Service 332 483 45.48 19.4 18.7 Other 655 1395 112.97 38.4 54 Total 1.708 2.585 51.34 100 100 Appendix 1 (2)Historical Statistics 2000/2001Regional Movements 1st Semester
Company Movements Movements Variation % Repartition In % 2000 2001 2001/2000 2000 2001 Lina Congo 679 767 12.96 7.4 10.7 T.A.C 3788 1982 -47.67 41.3 27.7 Aero Service 1720 1821 5.87 18.7 25.5 Equaflight 602 0 6.6 0 Air Atlantis 360 212 -41.11 3.9 3 A.A.C. 0 332 0 4.6 Others 2026 2037 0.54 22.1 28.5 Total 9.175 7.151 -22.05 100 100 Appendix 1 (3)Historical Statistics - 2000/2001National Movements 1st Semester