Download
1 / 60
600 likes | 700 Views
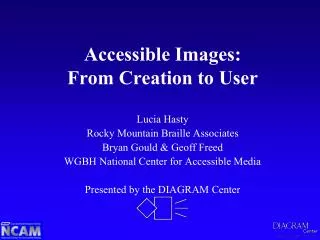
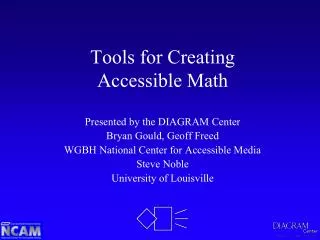
DIGITAL ACCESSIBLE MATH IMAGES. Presented by the DIAGRAM Center Bryan Gould WGBH National Center for Accessible Media. Introduction Overview of Digital Alternatives to Images STEM Description Guidelines MathML DIAGRAM Tools & Resources. D igital I mage A nd G raphic R esources

E N D
DIGITAL ACCESSIBLE MATH IMAGES Presented by the DIAGRAM Center Bryan Gould WGBH National Center for Accessible Media
Introduction Overview of Digital Alternatives to Images STEM Description Guidelines MathML DIAGRAM Tools & Resources
Digital Image And Graphic Resources for Accessible Materials • 5-year Research & Development Center • Funded by Department of Education, Office of Special Education Programs (OSEP) • Awarded to Benetech along with partners: • NCAM • U.S. Fund for DAISY
(some of) DIAGRAM Activities • Description guidelines training • Product evaluation matrices • User survey on reading technologies • Report on metadata images • SVG and 3D printing evaluation • Audio-Tactile usability study • POET • Standard development: content model • Collaboration with Mathematics eText Research Center (MeTRC, U. of Oregon) • diagramcenter.org
NCAM (est. 1993) • Research and Development • develops technical solutions • conducts research • promotes advocacy via outreach • supports national policy decisions
What about Recorded Descriptions? Images are often described on-the-fly or recorded by a narrator. Many math images are best described by linear, narrative description or “traditional” description. Many of the following guidelines will apply!
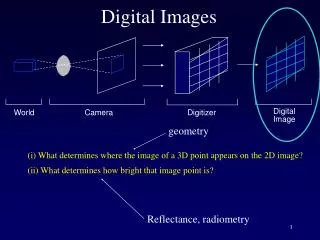
Two graphs. For both, the y-axis is labelled "area" and the x axis is labelled "side of square.” The first graph shows 5 points plotted: (0,0) (1,1) (2,4) (3,9) (4,16). The second graph shows the same points and a line connecting the points. The line begins at (0,0) and curves steeply upward through (4,16).
Other alternatives: Tactile Haptic
How to Write Descriptions • Be a subject matter expert. • Write well and take care to review spelling, grammar and punctuation. • Monitor length, vocabulary and sentence structure to minimize cognitive load. • Review image in context to ensure the proper tone, structure and vocabulary. • Have access reference materials. • Descriptions should be reviewed by someone who has not seen the image, to ensure clarity and effectiveness.
How to Write Descriptions The description author should consider three basic questions about each image in order to give effective and efficient description. • Why is the image there? • Who is the intended audience? • If there is no description what will the viewer miss?
Assessments Research & Professional Development http:// ncam.wgbh.org/experience_learn/educational_media/describing-images-for-enhanced
Easy Medium Difficult • Easy images include anything that can easily be described within a minute by a trained describer. • Medium images take more effort and usually require more description than a sentence or two. • Difficult images require the describer to stop to consider how to best describe this image and often require the describer to create a data table or nested list.
Context A chemist has two containers, Mixture A and Mixture B. Mixture A has a 60% copper sulfate concentration. Mixture B has a 5% copper sulfate concentration. The chemist needs to have a mixture equaling 500 mL with a 15% concentration. How much of each mixture does the chemist need?
Context This is an image of the state flag of Colorado
This is an image of the state flag of Colorado It turns out that the diameter of the gold circle 1/3 the total height of the flag (the same width as the white stripe) and the outer diameter of the red circle is 2/3 of the total height of the flag. The angle formed by the missing portion of the red circle is pi/4 radians. In a flag that is 66 inches tall, what is the area of the red portion of the flag to the nearest square inch?
STEM Description Guidelines Four years of NSF-funded research produced guidelines for making STEM images accessible. STEM = Science, Technology, Engineering and Math
Brevity The most frequent recommendation from respondents was for more brevity in description. It takes people with visual impairments more time to read books and articles than people without visual impairments and the process should not be further slowed down by unnecessarily long image descriptions.
Brevity PREVIOUS Descriptive Practice: • The figure is a Venn diagram and shows 2 intersecting circles inside a large rectangle. The circles do not touch the rectangle. The circle on the left contains the numbers 1 and 2. The circle on the right contains the numbers 4 and 5. The intersection of the 2 circles is shaded and has the number 3 in the shaded region. Outside of the circles but still inside the rectangle is the number 6. PREFERRED Descriptive Practice: • The Venn diagram shows 2 intersecting circles, one contains the numbers 1 and 2, the other circle contains the numbers 4 and 5. The area of intersection contains the number 3. The number 6 is outside the circles.
Data Description should focus on the data and not extraneous visual elements. Elaborately illustrated diagrams often contain key data that can be made accessible by presenting the data separate from description of the overall image.
PREVIOUS: Description emphasizes visual Carbon Cycle In a diagram titled "Carbon Cycle," numbers and arrows illustrate the movement of carbon through Earth's atmosphere, land, ocean, and interior. Black numbers indicate amounts of stored carbon. Purple numbers and arrows indicate annual fluctuations of carbon. Amounts are measured in GtC - giga tons of carbon. Colorful pictures depict a sunny landscape with elements of the carbon cycle. Four long arrows encircle the landscape, representing the cycling of carbon. Carbon is stored in many places: 750 GtC in the atmosphere; 610 GtC in vegetation; 4,000 GtC in fossil fuels and cement production; 1,580 GtC in soils; 3 GtC underwater in marine biota; less than 700 GtC in dissolved organic carbon underwater; 150 GtC in soil sediments beneath the water; 38,100 GtC in the deep ocean; and 1,020 in the surface ocean. On land, many factors cause annual fluctuations of carbon in the atmosphere. An arrow points away from a factory's smoky chimneys, illustrating how fossil fuels and cement production release 5.5 GtC into the atmosphere. On the other side of a river, an arrow points to a grove of pine trees, illustrating the trees absorption of 0.5 GtC from the atmosphere. Across the hilly landscape, cows graze near a tractor plowing a field. Nearby, arrows point to and from another grove of trees: one arrow rises from the trees and another points to it, illustrating an exchange of carbon: 121.3 GtC is absorbed by the trees and 60 GtC is released into the atmosphere. A fire burns beside several fallen trees, depicting deforestation. An arrow rises from the fire, showing how deforestation releases 1.6 GtC into the atmosphere. Another arrow points away from a layer of brown soil beneath the trees, illustrating how soils release 1,580 GtC into the atmosphere. In the ocean, depicted as a deep blue pool, many factors cause annual fluctuations of carbon. One arrow rises from the surface ocean and another points to it, illustrating an exchange of carbon: the atmosphere absorbs 90 GtC from the surface ocean and releases back 92 GtC. Another pair of arrows shows how the surface ocean exchanges carbon with marine biota: marine biota absorb 50 GtC from the surface ocean and release back 40 GtC. In addition, the surface ocean exchanges carbon with the deep ocean: the deep ocean absorbs 91.6 GtC and releases back 100 GtC. Other annual fluctuations occur without exchanges: an arrow points from marine biota to dissolved organic carbon in the ocean, illustrating a release of 6 GtC. The direction of another arrow shows how dissolved organic carbon releases 6 GtC to the deep ocean. An arrow points from the deep ocean to the layer of brown sediments beneath it, illustrating how the deep ocean releases 0.2 GtC to the sediments.
PREFERRED: Description emphasizes data The diagram is titled "Carbon Cycle." Colorful pictures depict farms, forests, rivers, oceans and industry. Four arrows encircle the diagram, representing the cycling of carbon. Smaller arrows illustrate Storage of Carbon and Fluxes in Carbon through Earth's atmosphere, oceans and land. Amounts are measured in G t C - gigatons of carbon. Carbon Storage and Annual Fluxes in Carbon are depicted in the following tables.
Clarity If the reader needs to listen to a description several times because it is poorly written or is presented in a confusing manner, then it is not accessible.
Drill-Down and Logical Organization Drill-Down = brief summary followed by extended description and/or specific data. Drill-Down organization allows the reader to either continue reading for more information or stop when they have read all they want.
Drill-Down The figure is a pie chart. Title: Municipal Solid Waste by Weight • Paper and cardboard 40% • Other waste19% • Yard waste 18% • Plastics 8% • Glass 7% • Metals containing iron 7% • Aluminum 1%
Logical A diagram shows the sun above a flagpole. The flag pole is 25 ft tall. The flag pole and the ground form a right angle. From the sun, a ray of light crosses the top of the flagpole and touches the ground 42 ft to the right of the flag pole. This forms the hypotenuse of a right triangle. The angle between the top of the flag pole and the sun’s ray is labeled X.
Logical Image: The Colorado state flag The flag is made up of three horizontal bands of equal height. The top and bottom bands are blue, the middle band is white. In the center of the flag are two concentric circles. The center circle is yellow. The outer circle is red. The outer red circle is missing a portion on the right side, so that it forms a letter C.
Tables and Lists Tables, charts and graphs should be presented as tables, not as narrative description. Proper coding (captions, table headers, and table data) provide better access to tables than narrative description. Brief summaries or overviews of the charts should be presented before the tables. Processes that are presented visually can be converted into nested lists with good results.
Lists A ling graph titled Evaporation of Water shows changes in water as temperature increases over time. • 0 minutes to 10 minutes. Temperature increases from -20C to 0C. Water is solid. • 10 min to 20 min. Temperature holds at 0C. Water is melting. • 20 min to 30 min. Temperature increases from 0C to 100C. Water is liquid. • 30 min to 40 min. Temperature holds at 100C. Water is boiling. • 40 min to 50 min. Temperature increases from 100C to 120. Water is gas.
MathML Math equations should be marked up with MathML and rendered in a way that is preferable to the individual reader.
DOED OSEP Recommendation June 22, 2012 NIMAS recommends ...MathML be used to improve the accessibility of mathematical and scientific content in core instructional materials ...as the most effective method of providing accessible print instructional materials involving mathematical and scientific content to students who are blind or who have print disabilities.
MathML z equals 2 a plus b squared over c
MathML z equals 2 a plus b squared over c
MathML <math display='block'> <semantics> <mrow> <mi>z</mi><mo>=</mo><mn>2</mn><msup> <mrow> <mfrac> <mrow> <mrow><mo>(</mo> <mrow> <mi>a</mi><mo>+</mo><mi>b</mi> </mrow> <mo>)</mo></mrow> </mrow> <mi>c</mi> </mfrac> </mrow>
MathML Spoken Math (plain English) Refreshable braille & print braille Spoken Math (unambiguous)
MathML “z equals 2 a plus b squared over c” “z equals 2 times the fraction open parenthesis a plus b close parenthesis superscript 2 over c”
Math Editor MathML DTB Reader DTB Spoken Math (plain English) Refreshable braille & print braille Spoken Math (unambiguous)