Download
1 / 10
110 likes | 335 Views
AP Statistics Section 4.1 A Transforming to Achieve Linearity.

E N D
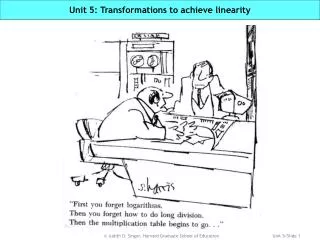
AP Statistics Section 4.1 ATransforming to Achieve Linearity
In Chapter 3, we learned how to analyze relationships between two quantitative variables that showed a linear pattern. When two-variable data shows a nonlinear relationship, we must develop new techniques for finding an appropriate model.
The process of changing the data mathematically to find a linear model is called ___________ or ____________ the data. transforming re-expressing
The transformations we will study are __________ and ______ transformations. These transformations change the scale of measurement that was used when the data was collected. power logarithmic
Example 1: Consider the average length and weight at different ages for Atlantic rockfish.
Use your calculator to draw a scatterplot of the data for length (x), in L1 and weight (y), in L2. Is it linear? ____ Is there a pattern? _____ Since there is a pattern, let’s try to “straighten” thedata. no yes
Since length is __ dimensional and weight (which depends on volume) is __ dimensional, let’s graph length3 (x), in L3 vs. weight (y) in L2. Is the scatterplot linear? ____ yes Highlight L3 ENTER L1 ^ 3 ENTER
Calculate the LSL on the transformed points (length3, weight) and determine r2.
Predict the weight of an Atlantic Rockfish that is 31.5cm long.