Download
1 / 24
240 likes | 386 Views
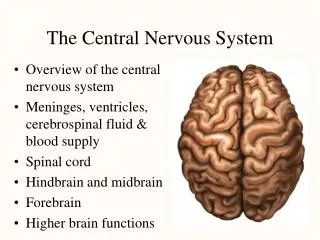
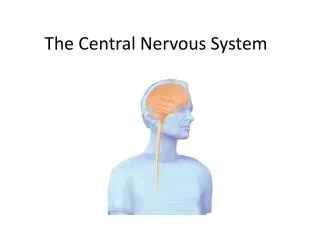
The Central Place System in the Northwest. Atlas - p. 127-139: Maps & text Consumer-oriented services & industry locally oriented manufacturing construction transportation/communications/utilities retail & wholesale trade finance, insurance, & real estate personal services

E N D
The Central Place System in the Northwest Atlas - p. 127-139: Maps & text Consumer-oriented services & industry locally oriented manufacturing construction transportation/communications/utilities retail & wholesale trade finance, insurance, & real estate personal services local government
Distribution of Central Place Functions Retail - p. 137 atlas Eating & Drinking - p. 137 atlas Hotels & Lodging, p. 137 atlas Health Services, p. 137 atlas (map) Wholesale Trade, p. 137-8 atlas (map) (Producer Services) p. 137 atlas Other services (consumer, government)
Logic of Central Place System: Its Linkage with Basic Industry Basic Industry = Export Tied Industry Nonbasic = locally tied industry What is basic at one level of the central place system is often nonbasic at Higher levels Backward linkages play a role in the relationship between the level of export/basic jobs and nonbasic/local jobs
Early Settlement Agricultural Interior • • • • • • • • • • • Water • • • • Coastal • • •• • • • • • Basic jobs Direct Jobs • Indirect jobs •
Early Settlement - First Hierarchy Agricultural Interior • • • • • • • • • • • • • • • • • Water • • • • Coastal • • •• • • • • • Basic jobs Direct Jobs • Indirect jobs •
Settlement - The Hierarchy in Modern Times Agricultural Interior • • • • • • • • • •• • • • • • • • • • • • • • • • • • • • • • • • Water • • • • Coastal • • •• • • • • • Basic jobs Direct Jobs • Indirect jobs •
Settlement - The Hierarchy in Coming Years? Agricultural Interior • • • • • • • • • • • • • • • • •• • • • • • • • • • • • • • • • • • • • • • • • • • Water • • • • Coastal • • • • •• • • • • • Basic jobs Direct Jobs • Indirect jobs • New Economy •
From Vision 2040, the current Puget Sound Regional Council regional development plan
Economic Base & The Settlement System Exports The Region Imports Local Multiplier Effects
Washington Input-Output Table ($ billions)Net industrial exports are roughly offset by imports to industries and categories of final demand (households, investment, state & local govt.) Imports to Consumption, Investment, Government 68.2 Industrial Imports Net Industrial Exports: 246.7 – 193.9 = 52.8 Industrial Exports
Generalized Model of Trade Dividing up the columns in this model, we have:
Consequences of A Change in Export Levels Through the Multiplier System
Shifts in the Structure of This System of Multipliers over Time Local purchases expand as thresholds are crossed Continued specialization offsets threshold effects Upshot: relative stability Shift to a larger service economy Spatial shifts due to lowered transport and interaction costs
Export Markets – Washington State Source: Washington State Input-Output Tables
Composition of Washington Exports Source: Washington State Input-Output Tables
Old Slide after this one • Left in PowerPoint file for those interested in history
Washington I/O Table ($ billions)Net industrial exports are roughly offset by imports to industries and categories of final demand (households, investment, and state and local governments) Imports to Consumption & Other F.D. 49.1 Industrial Imports Net Industrial Exports: 155.9-110.9 = 45.0 Industrial Exports