Download

1 / 15
150 likes | 676 Views
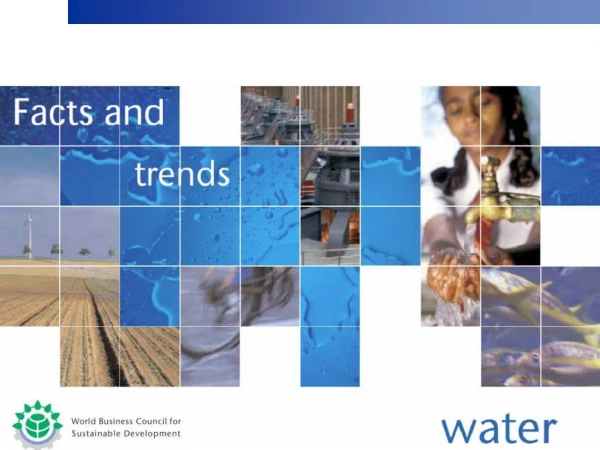
The Global Situation. The « Big » Water Cycle . Annual Renewable Water (m 3 /person/year). Who Uses Freshwater?. Agriculture. Percentage of Total Water Used for Irrigation. Industry. Water for energy

E N D
Agriculture Percentage of TotalWaterUsed for Irrigation
Industry • Water for energy • Multi purpose hydro projects manage water for many interests: flood control, irrigation, recreation, drinking water, energy. • Cooling water • The largest single use of water by industry is for cooling in thermal power generation. • Process water • Industry uses water to make steam for direct drive power and for use in various production processes or chemical reactions. • Water for products • E.g. food, beverage and pharmaceutical sectors consume water by using it as an ingredient in finished products for consumption. • Water as a medium for waste disposal • Many businesses dispose of wastewater or cleaning water into natural fresh water systems., e.g. rivers and lakes.
People • Individuals must have clean water for drinking or they fall ill and die. People also need fresh water for cooking, washing, and sanitation. More than one billionpeople, most of them inAsia, are still withoutimproved drinking watersources 3,900 children die each day due to dirty water or poor hygiene 2.6 billion people withoutimproved sanitation 1.8 million people die every year from diarrhoeal diseases (including cholera) – the equivalent of 15 killer tsunamis each year or 12 Boeing 747 crashes every day
Per Capita Use of Water Global coverage figures from 2002 indicate that, ofevery 10 people: • roughly 5 have a connection to a piped water supply athome (in their dwelling, plot or yard); • 3 make use of some other sort of improved watersupply, such as a protected well or public standpipe; • 2 are unserved; • In addition, 4 out of every 10 people live withoutimproved sanitation.
Water Stress This map projects how much water will be withdrawn with respect to the amount that is naturally available.
Four WaysPeopleContribute to Water Stress • Excessive withdrawal from surface waters • Excessive withdrawal of water from underground aquifers • Pollution of fresh water resources • Inefficient use of freshwater Over the past 30 years, the Aral Sea in the former Soviet Union has shrunk toless than half of its original size.
Signs of Hope Trends in service levels for drinking water Tanzania was only 38% covered in1990, and in 2002 was 73% covered. In 2002, 83% of the world’spopulation – around 5.2 billionpeople – had improved drinkingwater sources.
Good News & Bad News There is a lot of fresh water in the world … It’s not aways where man needs it Water is free from nature … Infrastructure needed to deliver water is expensive In many areas, water is easily accessible at low cost … People assume it will always be available & take it for granted There is a huge amount of water underground … Man is using it faster than nature can replace it 5 bn people have reasonable access to fresh water … Over 1 bn do not
What can Industry do to AlleviateWater Stress? • Put its own housein order by • Measuring and monitoring water use • Continuing to reduce water consumption • Encouraging suppliers and purchasers to adopt best management practices • Innovating • Enter into creativepartnerships with • Municipalities • Non-governmentalgroups • The scientificcommunity
More Info… www.wbcsd.org