Download
1 / 14
140 likes | 220 Views
Explore groundwater contamination post oil spill in Bemidji, MN using GIS techniques for effective monitoring and modeling of contaminant distribution, migration, and concentration over time. Study includes 3D profiles of hydrocarbon plume and aquifer framework.

E N D
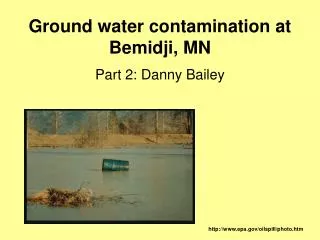
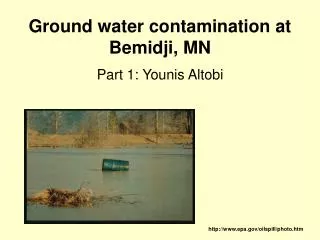
Ground water contamination at Bemidji, MN Part 1: Younis Altobi http://www.epa.gov/oilspill/photo.htm
Outline: Younis Altobi • Introduction • Significance • Description of site • Study objectives • Data • Methodology • Data analysis • Data interpretation • Results • Limitations • Future Work http://www.epa.gov/oilspill/photo.htm
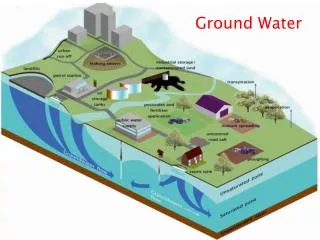
Introduction • Most oil pipelines leak at least once during their life span. • ~14,000 spills a year are reported in the U.S. • Spills pose hazards to: • marine and human life • natural and man-made resources • Each spill’s environmental impact depends on its spreading rate. http://www.epa.gov/oilspill/photo.htm
Significance Problem: • Treatment and remediation challenges: • Time consumption • Costs in training and equipment • Inaccurate site assessments Possible solution: • Apply GIS techniques to monitor and model: • Contaminant distribution with time. • Contaminant migration with time. • Contaminant concentration with time.
Description of Site • NW Bemidji, MN • In 1979, a pipeline burst, spilling ~11,000 barrels of crude oil. • Contaminated subsurface sediment and ground water. http://mn.water.usgs.gov/bemidji/gif/locatn-1.jpg
Study Site http://mn.water.usgs.gov/bemidji/gif/fig4.jpg http://mn.water.usgs.gov/bemidji/
Study Objectives Using GIS techniques and utilizing Arc Hydro Groundwater Data Models devised by Gil Strassberg and Suzanne Pierce (CRWR) • 2-Dimentional surface-ground water interaction data model using aquifer, stream networks, aquifer recharge and contaminant transport. • 3D geological framework of the aquifer using wells, coring and test data. • Model groundwater movement through out the aquifer. • Model hydrocarbon migration since the 1979 oil spill through out the aquifer. • Model the aquifer hydrologic unit to determine the effects of lithology and porosity on water and hydrocarbon movements. • Produce a 3D distribution profile of the hydrocarbon plume across the site.
Objectives accomplished • 3D geological framework of the aquifer using water wells and coring. • Model hydrocarbon migration since the 1979 oil spill through out the aquifer. • Produce a 3D distribution profile of the hydrocarbon plume across the site. • 3D surface topography of the site. • Ground water level changes through time. • Oil level, thickness, and concentration through time.
Data • Wells (over 200 total wells) • Water level • Oil level • Oil thickness • Oil concentration (Benzene and Toluene) • Core • Elevation Data source: http://mn.water.usgs.gov/bemidji/data.html
Data Analysis • Select wells from area of interest (north pool). • Create a surface elevation. • Produce a 3D projection of core lithologies. • Using well attributes, we distributed: • Water level • Oil level • Oil thickness • Oil concentrations • Time Frame (3 periods)
Data Analysis: Surface elevation • Surface interpolated from selected surface elevation points distributed across the study site.
Acknowledgments • Gil Strassberg (CRWR) • Dr. David Maidment • Suzanne Pierce (UTDoGS) • Geoff Delin and Todd Anderson • http://mn.water.usgs.gov/bemidji/