Download
1 / 13
130 likes | 280 Views
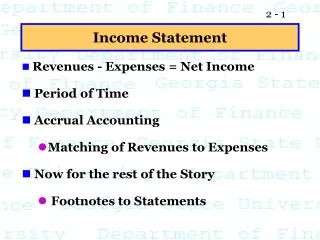
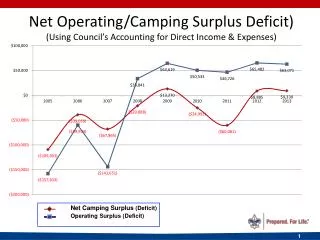
Net Operating/Camping Surplus Deficit) (Using Council’s Accounting for Direct Income & Expenses). Net Camping Surplus (Deficit ) Operating Surplus (Deficit ). Net Friends of Scouting Income. 2013 Journey To Excellence Criterion #1.

E N D
Net Operating/Camping Surplus Deficit)(Using Council’s Accounting for Direct Income & Expenses) Net Camping Surplus (Deficit) Operating Surplus (Deficit)
2013 Journey To Excellence Criterion #1 Operating Fund Unrestricted Net Assets(Retained Earnings)
2013 Journey To Excellence Criterion #2 Council-Generated Support(FOS, project sales, special events, foundations & trusts, other direct) Leading Indicator
Operating Fund Liquidity Position (Cash & short term investments divided by accounts payable, accrued expenses & custodial accounts) 1.33 National Standard (Liquidity Ratio)
Net Debt Position – Total All Funds (Operating cash & investments less accounts payable, notes payable, long term debt, & interfund loans) Positive number indicates no net debt Negative number indicates net debt
Endowment Fund Net Assets Permanently Restricted Unrestricted/Temporarily Restricted
2013 Journey To Excellence Criterion #14 Units Visited Six or More Times(As Recorded in Unit Visitation Tracking System)
2013 Journey To Excellence Criterion #17 Average District Committee Size Leading Indicator Council Average Regional Average 22.2 2013 National Average
Top Leaders Trained(BSA Records for CM, SM, VC, NL, SK, EA) Council Percentage Area Average 49.1 2013 National Average
2013 Journey To Excellence Criterion #5 Membership/Youth Growth Council Growth Area Average -5.9% 2013 National Average