
Variability of AUC/MIC for Moxifloxacin's Antibacterial Effect in Staphylococcus aureus
This study evaluates the variability in the AUC/MIC ratio of moxifloxacin, focusing on its clinical implications for Staphylococcus aureus. Utilizing an in vitro pharmacokinetic model, we analyzed five S. aureus strains to assess how different AUC/MIC ratios affect antibacterial effect (ABE) outcomes. Our findings indicate significant strain-to-strain differences, suggesting that predefined AUC/MIC targets may not account for this variability, potentially impacting valid clinical breakpoint settings. Further, we propose incorporating variability measures in pharmacodynamics to enhance clinical decision-making.

Variability of AUC/MIC for Moxifloxacin's Antibacterial Effect in Staphylococcus aureus
E N D
Presentation Transcript
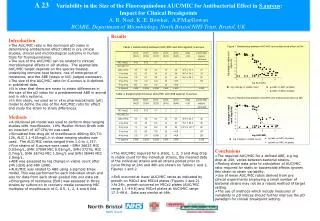
A 23Variability in the Size of the Fluoroquinolone AUC/MIC for Antibacterial Effect in S.aureus: Impact for Clinical BreakpointsA. R. Noel, K.E. Bowker, A.P.MacGowanBCARE, Department of Microbiology, North Bristol NHS Trust, Bristol, UK Results • Introduction • The AUC/MIC ratio is the dominant pD index in determining antibacterial effect (ABE) in pre clinical studies, clinical and microbiological outcome in human trials for fluoroquinolones. • The size of the AUC/MIC can be related to clinical/microbiological effects in pD studies. The appropriate AUC/MIC target depends on the species treated, underlying immune host factors, risk of emergence of resistance, and the ABE (stasis or kill) judged necessary. • The size of the AUC/MIC ratio for S.aureus is ill-defined in published data. • It is clear that there are strain to strain differences in the size of the pD index for a predetermined ABE in animal and in vitro systems. • In this study, we used an in vitro pharmacokinetic (pK) model to define the size of the AUC/MIC ratio for effect and study the strain to strain differences. • Methods • A dilutional pK model was used to perform dose ranging studies with moxifloxacin. 10% Mueller-Hinton Broth with an inoculum of 106 CFU/ml was used. • Simulated free drug pK of moxifloxacin 400mg OD;T½ 12h, AUC 1.1‑416mg/L.h in dose ranging studies was used. The AUC/MIC ratios ranged from 1.0 to 1,157. • Five strains of S.aureus were used:- SMH 36633 MIC 0.03mg/L, SMH 37099 MIC 0.03mg/L, SMH 37276, MIC 0.7mg/L, SMH 36742 MIC 1.0mg/L and SMH 36945 MIC 2.0mg/L. • ABE was assessed by log change in viable count after 24h (d24) and 48h (d48). • AUC/MIC was related to ABE using a sigmoid Emax model. This was performed for each individual strain and also for data from each strain pooled into one data set. • Emergence of resistance (EoR) was assessed in three strains by culture on to recovery media containing MIC multiples of moxifloxacin of 0, 0.5, 1, 2, 4 and 8 fold. Table 1 Relationship between AUC/MIC and d24 against S.aureus Table 2 Relationship between AUC/MIC and d48 against S.aureus Conclusions • Therequired AUC/MIC for a defined ABE, e.g log drop at 24h, varies between bacterial strains. Pooling strain data prior to calculation of AUC/MIC ratio required for static or bactericidal effects ignores this strain to strain variability. Use of mean AUC/MIC ratios derived from pre clinical experiments employing a small number of bacterial strains may not be a robust method of target setting. The use of methods which include measures of variability in pD indices should further improve the pD paradigm for clinical breakpoint setting. • The AUC/MIC required for a static, 1, 2, 3 and 4log drop in viable count for the individual strains, themeaned data of the individual strains and all strains pooledprior to curve fitting at 24h and 48h are shown on Tables 1 and 2, Figures 1 and 2. • EoR occurred at lower AUC/MIC ratios as indicated by growth on MICx2 and MICx4 plates (Figures 1 and 2). • At 24h, growth occurred on MICx2 plates (AUC/MIC range 1.1‑49.6) and MICx4 plates at AUC/MIC range 17.3‑49.6. Data was similar at 48h.


