Download
1 / 37
370 likes | 496 Views
Hot Topics, Questions and Misconceptions about Climate Change. Who do you trust…?.

E N D
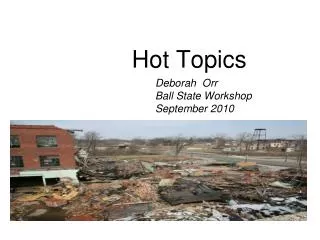
Hot Topics, Questions and Misconceptions about Climate Change
Who do you trust…? “As a rule of thumb, those working for an organization which conducts primary research on climate science (e.g. NASA, NOAA, CSIRO or Universities), and publishes this work in peer-reviewed scientific journals (the industry gold standard), should have their theories taken seriously. This is because they are following the scientific process – the same process that underpins the massive literature reviews of the Intergovernmental Panel on Climate Change (IPCC) assessment reports, and indeed the same process that has taken man to the moon, decoded the genome, and given you digital watches, laptop computers and automobiles. In any research field there will, of course, be diverse opinions about causes and effects – the positing, testing and overturning of theory and hypotheses are at the very core of science. Provided such arguments are bound by empirical or experimental evidence, and have survived rigorous pre-publication scrutiny and review, then they should be considered a valid viewpoint.” Prof. Schneider, Professor for Interdisciplinary Environmental Studies, Professor of Biological Sciences, and Professor by Courtesy of Civil and Environmental Engineering at Stanford University, Co-Director of the Center for Environmental Science and Policy in the Freeman-Spogli Institute and a Senior Fellow in the Woods Institute for the Environment. He received his PhD in Mechanical Engineering and Plasma Physics from Columbia University, USA, in 1971.
There is no “scientific consensus” on global warming This question (is there a consensus on warming) can be addressed in a scientific manner itself! • The earth is getting warmer (0.6 +/- 0.2 C in the past century; 0.1 0.17 C/decade over the last 30 years • People are causing this • If GHG emissions continue, the warming will continue and indeed accelerate
48% of Americans think climate scientists do not agree that the Earth has been warming 53% think climate scientists do not agree that human activities are a major cause of that warming
Proceedings of the National Academy of Sciences Anderegg et al. (2010) http://www.pnas.org/content/early/2010/06/04/1003187107.abstract?sid=5ce5529a-3fb5-422c-9eab-acb264229858
Survey: 1372 climate researchers • Their publications and citation record • Results: • 97–98% of the climate researchers actively publishing in the field support the tenets of anthropogenic climate change outlined by the Intergovernmental Panel on Climate Change • The relative climate expertise and scientific prominence of the researchers unconvinced of ACC are substantially below that of the convinced researchers
What specifically are the “tenets of the IPCC”? • Global atmospheric concentrations of carbon dioxide, methane and nitrous oxide have increased markedly as a result of human activities since 1750 and now far exceed pre-industrial values determined from ice cores spanning many thousands of years. The global increases in carbon dioxide concentration are due primarily to fossil fuel use and land-use change, while those of methane and nitrous oxide are primarily due to agriculture. • The understanding of anthropogenic warming and cooling influences on climate has improved since the Third Assessment Report (TAR), leading to very high confidence that the globally averaged net effect of human activities since 1750 has been one of warming, with a radiative forcing of +1.6 [+0.6 to +2.4] W m2. • Warming of the climate system is unequivocal, as is now evident from observations of increases in global average air and ocean temperatures, widespread melting of snow and ice, and rising global average sea level. • At continental, regional, and ocean basin scales, numerous long-term changes in climate have been observed. These include changes in Arctic temperatures and ice, widespread changes in precipitation amounts, ocean salinity, wind patterns and aspects of extreme weather including droughts, heavy precipitation, heat waves and the intensity of tropical cyclones • Paleoclimate information supports the interpretation that the warmth of the last half century is unusual in at least the previous 1300 years. The last time the polar regions were significantly warmer than present for an extended period (about 125,000 years ago), reductions in polar ice volume led to 4 to 6 metres of sea level rise. • Most of the observed increase in globally averaged temperatures since the mid-20th century is very likely due to the observed increase in anthropogenic greenhouse gas concentrations. This is an advance since the TAR’s conclusion that “most of the observed warming over the last 50 years is likely to have been due to the increase in greenhouse gas concentrations”. Discernible human influences now extend to other aspects of climate, including ocean warming, continental-average temperatures, temperature extremes and wind patterns. • Analysis of climate models together with constraints from observations enables an assessed likely range to be given for climate sensitivity for the first time and provides increased confidence in the understanding of the climate system response to radiative forcing. • For the next two decades a warming of about 0.2°C per decade is projected for a range of SRES emission scenarios. Even if the concentrations of all greenhouse gases and aerosols had been kept constant at year 2000 levels, a further warming of about 0.1°C per decade would be expected. • Continued greenhouse gas emissions at or above current rates would cause further warming and induce many changes in the global climate system during the 21st century that would very likely be larger than those observed during the 20th century. • There is now higher confidence in projected patterns of warming and other regional-scale features, including changes in wind patterns, precipitation, and some aspects of extremes and of ice. • Anthropogenic warming and sea level rise would continue for centuries due to the time scales associated with climate processes and feedbacks, even if greenhouse gas concentrations were to be stabilized.
“I have this list of 40,000 signatures of scientists that don’t believe in global warming…”
More “consensus” issues… • “Consensus” isn’t science! • "Scientific knowledge is the intellectual and social consensus of affiliated experts based on the weight of available empirical evidence, and evaluated according to accepted methodologies. If we feel that a policy question deserves to be informed by scientific knowledge, then we have no choice but to ask, what is the consensus of experts on this matter." Historian of Science, Dr Oreskes, UC San Diego • Medical doctor example… • What about Galileo? (or Darwin or Einstein?) • Presented views well outside of the consensus view at the time • These scientists were able to PROVE that they were correct and that the consensus was wrong. • One never hears about the thousands of scientists that went against the consensus –and ended up being wrong. • To date, not a single scientist has been able to demonstrate with a reasonable certainty a natural cause of the modern warming trend while also showing how human emissions of greenhouse gases is a minor forcing mechanism
In the 1970s the scientific consensus was on “global cooling”!
“the number of papers classified as predicting, implying, or providing supporting evidence for future global cooling, warming, and neutral categories”: • Bulletin of the American Meteorological Society: • Comprehensive survey of all peer-reviewed articles on climate change during the 1970s • The survey identified only 7 articles indicating cooling compared to 44 indicating warming. Those seven cooling articles garnered just 12% of the citations. “There was no scientific consensus in the 1970s that the Earth was headed into an imminent ice age. Indeed, the possibility of anthropogenic warming dominated the peer-reviewed literature even then.” Peterson, Connolley, and Fleck, 2008
National Research Council 1979 meeting: panel on climate change Produced a national report The panel concluded that the potential damage from greenhouse gases was real and should not be ignored. The potential for cooling, the threat of aerosols, or the possibility of an ice age shows up nowhere in the report. Warming from doubled CO2 of 1.5°–4.5°C was possible, the panel reported. National Academy of SciencesNational Academy of EngineeringInstitute of MedicineNational Research CouncilOffice of News and Public InformationOffice of Congressional and Government Affairs
What information makes its way into the media? vs If a national report in the 1970s advocates urgent action to address global warming, then the scientific consensus of the 1970s was not global cooling.
“This is just a natural cycle” • What is behind this cycle? • Without a forcing, there is no change (trend) • How does “natural cause” accommodate a 39% increase in 2nd most effective GHG not affecting global temperature • Climate science: well-developed internally consistent theory matched by obs. to expl. recent warming • No other forcing (i.e. Milankovitch, solar etc) that expl. the very detailed information in ice cores etc
“Carbon dioxide is natural!” http://www.youtube.com/watch?v=URGcs4WV1fY
CO2 is natural… 2007 IPCC Carbon “budget” circa 1990: 190.2 GtC emitted,190 GtC absorbed Red values anthropogenic, black values naturally occuring
CO2 is natural… • Natural land and ocean CO2 sinks removed 57% (~5 Gigatons per year) of all CO2 emitted from human activities during the 1958-2008. • During this period the size of the natural sinks has grown but at slower pace than emissions have grown, although year-to-year variability is large. • This implies a decline in the efficiency of the sinks in removing atmospheric CO2 over time (from 60% fifty years ago down to 55% in recent years), a trend expected to continue the future.
Water vapor is more important than CO2! • Difference between forcing • i.e. CO2 if altered it will cause a change in climate • and feedback • A mechanism by which the forced change is amplified (+) or dampened (-) • If introduce 5 extra Gt C to atmosphere it will cause long term T increase • If introduce 5 extra Gt H2O to atm., it will rain out in a few days
BTW, water vapor is the most important feedback process… http://www.youtube.com/watch?v=M_s-h8AkVSo
CO2 lags temperature change! • At least three detailed ice core studies have shown that CO2 starts to rise about 800 years (600-1000 years) after Antarctic temperature (about the amount of time required to flush out the deep ocean through natural ocean currents, CO2 stored in the deep ocean during ice ages, and then gets released when the climate warms)
CO2 lags temperature change! • At least three detailed ice core studies have shown that CO2 starts to rise about 800 years (600-1000 years) after Antarctic temperature (about the amount of time required to flush out the deep ocean through natural ocean currents, CO2 stored in the deep ocean during ice ages, and then gets released when the climate warms) • This process also causes CO2 to start rising, about 800 years later. • Release of CO2 causes Antarctica and the surrounding ocean to warm. • Then CO2 further warms the whole planet, because of its heat-trapping properties. • This leads to even further CO2 release. So CO2 during ice ages should be thought of as a “feedback” • These warmings take about 5000 years to be complete…
Medieval Warm Period was warmer than today! Grapes in England! Norse Ruins Greenland colonized, Called Green-land as it was so warm!
Was MWP global…? NOAA Paleoclimate page: "The idea of a global or hemispheric "Medieval Warm Period" that was warmer than today however, has turned out to be incorrect." “Medieval Climate Anomaly” more accurate term… North Atlantic warmer BCP White Mtns, CA wetter Southwest US drought (disappearance of Anasazi), increased fire frequency Central tropical Pacific cooler IPCC Fourth Assessment Report, 2007
Antarctic icesheets are growing though! There was much uncertainty surrounding the dynamics of the Antarctic ice sheets –even recetly Satellite measurements give us the best estimate –thickness (volume, mass) is a better measure than length.
Antarctic Ice Sheets Growing…? Accelerated loss in West Antarctic Ice Sheet Increased snowfall in some areas Ice mass lost on Antarctica exceeded prior IPCC predictions
Global Warming Ended in 1998! UK Met. Office Hadley Centre NASA Goddard Inst. For Space Studies
NASA Goddard Inst. For Space Studies UK Met. Office Hadley Centre • Assumes warming follows nearest land based stations • Excludes Arctic • Based only on surface temperatures • Excludes ocean temperatures • No permanent weather stations in Arctic, where warming is greatest • What is important is total warming of whole atmosphere • Top of the atmosphere radiation budget- the radiation balance! • 90% excess heat into warming oceans, 3% into atmosphere • If oceans absorb less, land /atm heats up more; if oceans absorb more, decrease in atm/land temp
What happened in 1998 then, anyway? A “global warming spurt”…? 1998 was a particulalry strong El Nino No cold water upwelling Especially large area of Pacific Ocean very warm Increased heat transfer from ocean to atmosphere (in general, El Nino accompanied by warmer temps
We had record snow on east coast during winter 2009/2010 –how can you say there’s global warming? …or record cold in LA… …or freezing in Argentina… …or record rains in July in Mexico… etc The temperature of one place at one time is just weather, and says nothing about climate, much less climate change, much less again for global climate change…
You can’t trust the computer models… Can we? • Based on: • Well-established laws of physics • Extensive observations How well can they reproduce- Past climate changes (Glacial-interglacials)? Current climate change?
You can’t trust the computer models… 2007 IPCC Fourth Assessment Report
According to the IPCC 2007 WGI, Chapter 8 report by Randall, et al. (2007): • There is considerable confidence that Atmosphere-Ocean General Circulation Models (AOGCMs) provide credible quantitative estimates of future climate change, particularly at continental and larger scales. • Models now being used in applications by major climate modeling groups better simulate seasonally varying patterns of precipitation, mean sea level pressure and surface air temperature than the models relied on by these same groups at the time of the IPCC Third Assessment Repport (TAR). • Model global temperature projections made over the last two decades have also been in overall agreement with subsequent observations over that period. • Some AOGCMs can now simulate important aspects of the El Niño-Southern Oscillation (ENSO). • The ability of AOGCMs to simulate extreme events, especially hot and cold spells, has improved. • Atmosphere-Ocean General Circulation Models are able to simulate extreme warm temperatures, cold air outbreaks and frost days reasonably well. • Models also reproduce other observed changes, such as the faster increase in nighttime than in daytime temperatures and the larger degree of warming in the Arctic known as polar amplification. • Models account for a very large fraction of the global temperature pattern: the correlation coefficient between the simulated and observed spatial patterns of annual mean temperature is typically about 0.98 for individual models. This supports the view that major processes governing surface temperature climatology are represented with a reasonable degree of fidelity by the models. • The models, as a group, clearly capture the differences between marine and continental environments and the larger magnitude of the annual cycle found at higher latitudes, but there is a general tendency to underestimate the annual temperature range over eastern Siberia. In general, the largest fractional errors are found over the oceans (e.g., over much of tropical South America and off the east coasts of North America and Asia). These exceptions to the overall good agreement illustrate a general characteristic of current climate models: the largest-scale features of climate are simulated more accurately than regional- and smaller-scale features. • Models predict the small, short-term global cooling (and subsequent recovery) which has followed major volcanic eruptions, such as that of Mt. Pinatubo in 1991 • Simulation of extratropical cyclones has improved. Some models used for projections of tropical cyclone changes can simulate successfully the observed frequency and distribution of tropical cyclones. • The models capture the dominant extratropical patterns of variability including the Northern and Southern Annular Modes, the Pacific Decadal Oscillation, the Pacific-North American and Cold Ocean-Warm Land Patterns. • With a few exceptions, the models can simulate the observed zonal mean of the annual mean outgoing LW within 10 W/m2 (an error of around 5%) The models reproduce the relative minimum in this field near the equator where the relatively high humidity and extensive cloud cover in the tropics raises the effective height (and lowers the effective temperature) at which LW radiation emanates to space. • The seasonal cycle of the outgoing LW radiation pattern is also reasonably well simulated by models. • The models capture the large-scale zonal mean precipitation differences, suggesting that they can adequately represent these features of atmospheric circulation. Moreover, there is some evidence that models have improved over the last several years in simulating the annual cycle of the precipitation patterns. • Models also simulate some of the major regional characteristics of the precipitation field, including the major convergence zones and the maxima over tropical rain forests, although there is a tendency to underestimate rainfall over the Amazon. • Confidence has also increased in the ability of GCMs to represent upper-tropospheric humidity and its variations, both free and forced. Together, upper-tropospheric observational and modeling evidence provide strong support for a combined water vapor/lapse rate feedback of around the strength found in GCMs (approximately 1 W/m2 oC-1, corresponding to around a 50% amplification of global mean warming).
Remember- scientists publish peer-reviewed journal articles… They don’t usually have time for easy to understand blogs… or news shows Sounds daunting: How can an average citizen stay informed? NATS 101 students way more informed than Joe Public… but had to suffer through albedo, radiation budgets, and latent heat to make it this far…
Who do you trust…? “As a rule of thumb, those working for an organization which conducts primary research on climate science (e.g. NASA, NOAA, CSIRO or Universities), and publishes this work in peer-reviewed scientific journals (the industry gold standard), should have their theories taken seriously. This is because they are following the scientific process – the same process that underpins the massive literature reviews of the Intergovernmental Panel on Climate Change (IPCC) assessment reports, and indeed the same process that has taken man to the moon, decoded the genome, and given you digital watches, laptop computers and automobiles. In any research field there will, of course, be diverse opinions about causes and effects – the positing, testing and overturning of theory and hypotheses are at the very core of science. Provided such arguments are bound by empirical or experimental evidence, and have survived rigorous pre-publication scrutiny and review, then they should be considered a valid viewpoint.” Prof. Schneider, Professor for Interdisciplinary Environmental Studies, Professor of Biological Sciences, and Professor by Courtesy of Civil and Environmental Engineering at Stanford University, Co-Director of the Center for Environmental Science and Policy in the Freeman-Spogli Institute and a Senior Fellow in the Woods Institute for the Environment. He received his PhD in Mechanical Engineering and Plasma Physics from Columbia University, USA, in 1971.
NASA/Goddard Institute for Space Science http://www.nasa.gov/worldbook/global_warming_worldbook.html NOAA (National Oceanic and Atmospheric Administration http://www.ncdc.noaa.gov/oa/climate/globalwarming.html National Academy of Science (NAS) http://dels.nas.edu/climatechange/ NCAR (National Center for Atmospheric Research http://www.ncar.ucar.edu/researrch/climate/now.php American Meteorological Society (AMS) http://www.ametsoc.org/POLICY/2007climatechange.html EPA (Environmental Protection Agency) http://www.epa.gov/climatechange/ National Academy of Engineering National Weather Service World Glacier Monitoring Service Lawrence Livermore National Laboratory Department of Energy American Geophysical Union