Download
1 / 19
190 likes | 288 Views
Investigating the use of process data to determine the optimal number of call attempts in telephone surveys. This research from Sweden aims to design efficient call scheduling algorithms and survey methods.

E N D
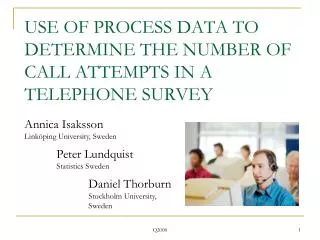
USE OF PROCESS DATA TO DETERMINE THE NUMBER OF CALL ATTEMPTS IN A TELEPHONE SURVEY Annica Isaksson Linköping University, Sweden Peter Lundquist Statistics Sweden Daniel Thorburn Stockholm University, Sweden Q2008
The Problem Consider a telephone survey of individuals, in which a maximum number A of call attempts is to be made to sampled individuals. HOW SHALL A BE CHOSEN? Part of a larger problem of designing efficient call scheduling algorithms. Q2008
Prerequisites • (Single-occasion survey) • Direct sampling from a frame with good population coverage • Estimation of a population total by the direct weighting estimator Observed value for individual k (proxy for the true value µk) Response set after A call attempts Estimated response probability for individual k after A call attempts Inclusion probability for individual k Q2008
The Survey as a Three-Stage Process • Stage 1: Sample selection • Stage 2: Contact and response Maximally A call attempts are made. Individuals respond in accordance with an unknown response distribution. • Stage 3: Measurement Observed values are related to the true values according to a measurement error model. Q2008
Response Model The sample can be divided into Hs response homogeneity groups (RHG) such that, for all A, given the sample, • all individuals within the same group have the same probability of responding • individuals respond independently of each other • individuals respond independently of each other after different numbers of call attempts Q2008
Measurement Error Model For an individual k in RHG h, given the sample and that the individual responds at call attempt a, Indicates if individual k responds at attempt a=ak Random interviewer effect with expectation 0 and variance True value for individual k Random response error with expectation 0 and variance Q2008
Bias and Variance Bias if the RHG model does not hold: Sample covariance between response probabilities and design weighted true values Average response probability within RHG The variance of is derived in the paper Q2008
Cost Function Q2008
Optimum A for RHG h Assume: of the costs are allocated to RHG h Q2008
Optimum A for RHG h: Result The optimum number of call attempts for RHG h is the number Ah that gives the lowest value on the function Q2008
Our Data LFS data from March-Dec. 2007, supplemented with: • Annual salary 2006 according to the Swedish Tax Register (our y) • Process data from WinDati (WD) . Note: not all WD events are call attempts Q2008
Data Processing and Estimation • Each monthly sample viewed as a SRS • Parameter: = total annual salary 2006 • Bias within RHG h and month l estimated by . Q2008
Measurement Error Model Parameters Intraclass correlation, ICC (Biemer and Trewin, 1997): = .002 = 55,267,619,616 = 110,979,155 . Q2008
No Bias, ICC = .002 Q2008
Bias, ICC = .002 Q2008
Tentative Results • Efficient planning requires high-quality data on processes and costs • Perhaps the choice of A should be based on variance rather than MSE Q2008
Discussion and Future Work • Do the results hold for other study variables, other survey settings? • Improved models for measurement errors, response and costs? • Develop a planning tool? Q2008
Thank you for your attention! Annica Isaksson, annica.isaksson@liu.se Peter Lundquist, peter.lundquist@scb.se Q2008