Download
1 / 12
120 likes | 228 Views
Understand the intricacies of unemployment metrics, who is classified as employed or unemployed, and alternate methods to interpret the data. Explore the significance of education levels and recession impact on job opportunities.

E N D
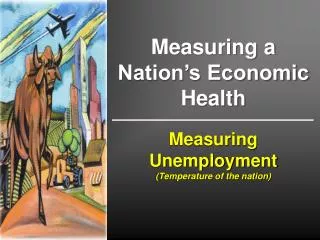
MEASURING UNEMPLOYMENT WHAT EXACTLY DO THE NUMBERS MEAN?
WHO IS EMPLOYED? • Worked at least one day during the survey week. • Currently sick or on leave but will return to a job. • Unpaid family worker working at least 15 hours a week in a family enterprise. • Students working part-time after school
WHAT DOES THE UNEMPLOYMENT NUMBER MEAN? The unemployment rate measures the percentage of people, over the age of 15 who: • do not have jobs and have actively looked for work in the preceding 4 weeks • are currently available for work or waiting to be called back after a layoff.
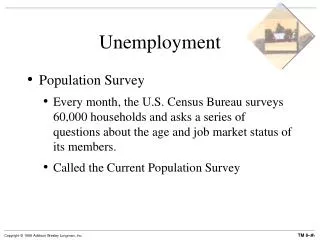
SURVEY ON UNEMPLOYMENT BLS calls 60,000 households every month. They ask three questions of members 16 years of age and older: • Are you working? If the answer is no, • Did you work at all this month-even 1 day? You are a member of the LF if “yes” on 1 or 2. • Did you look for work during the last month? A “yes” counts you as part of the LF. A “no” means you are not counted.
WHO IS NOT COUNTED AS UNEMPLOYED? • Discouraged workers (individuals who have stopped looking) • Under 16 years old • Homemakers • Retirees • Institutionalized • Part-time who really want full-time • Undocumented immigrants • Military personnel
OTHER WAYS TO MEASURE U-1: Persons unemployed 15 weeks or longer, as a percent of the civilian labor force (6/14: 2.9%) U-2: Job losers and persons who completed temporary jobs, as a percent of the civilian labor force (6/14: 3.1%) U-3: Total unemployed, as a percent of the civilian labor force (official unemployment rate, 6/14: 6.1%) U-4: Total unemployed plus discouraged workers, as a percent of the civilian labor force (6/14: 6.5%) U-5: Total unemployed, plus discouraged workers, plus all other persons marginally attached to the labor force, as a percent of the civilian labor force (6/14: 7.3%)
OTHER WAYS TO MEASURE • The U-6 number takes into consideration the discouraged and part-timers (underemployed). That number is currently 12.1% (6/14) • The Employment-Population Ratio measures the percentage of Americans who are holding a job. • The Unemployment Rate surveys 60,000 households monthly. • The Payroll numbers survey 150,000 businesses and government agencies. (Considered more accurate).
OTHER WAYS TO MEASURE LABOR PARTICIPATION RATE EMPLOYMENT TO POPULATION
ARE THESE CURRENT NUMBERS DEVASTATING? • The highest unemployment level in the last recession was 10.2% which is lower than the peak of the early 80s recession, 10.8%. • At the depths of the Great Depression unemployment hit 25% • The real problem has been the duration of unemployment • As of 6/2014, 32.8% have been jobless for > 27 weeks. Green = more than 15 weeks Blue = less than 15 weeks
THE VALUE OF AN EDUCATION • The unemployment rate for workers over 25 w/o college is 10% • For those w/o a high school diploma, 12.4% • For those with a 4-year degree, 4.8% • 4-year college graduates made 47% more, on average, then people who didn’t finish college, in 2012.
NO RECESSION FOR COLLEGE GRADS Even in the depths of the recession, when the national rate of unemployment topped 10%, the economy added 200,000 jobs for workers with bachelor’s degrees. Since the recovery began, 2 million more have been created Nearly 6 million jobs requiring a high school diploma or less have been lost since the downturn began. For recent graduates trying to work with only a high school diploma, nearly 24% are unemployed.