Download

1 / 50
500 likes | 773 Views
July 12, 2011. ArcGIS Server Performance and Scalability : Optimizing GIS Services. David Cordes, Eric Miller. Poll the Audience: Role. Raise your hand if you are. A GIS Analyst A GIS Manager An IT person An IT manager A Developer An Executive None of the above. Agenda.

E N D
July 12, 2011 ArcGIS Server Performance and Scalability : Optimizing GIS Services David Cordes, Eric Miller
Poll the Audience: Role Raise your hand if you are • A GIS Analyst • A GIS Manager • An IT person • An IT manager • A Developer • An Executive • None of the above
Agenda • Three case studies • Planning for Optimization (David Cordes) • Performance Testing (Eric Miller) • Performance Troubleshooting (David Cordes)
Planning for Optimization David Cordes
Planning Case Study: The Organization • Fortune 500 Utility • Maintaining massive infrastructure • Tens of thousands of sites • National scope • Repair and maintenance decisions made locally • Reduce costs • Respond to outages efficiently, minimize down-time • Keep technicians in the field utilized • Reduce hardware and software costs by moving from ArcIMS solution
Planning Case Study: The Goal • Replace dispatch application • Centrally managed servers • For internal users distributed throughout country • Provide information: • Technician availability • Estimate arrival times for available technicians • Let dispatcher assign technician to job • Send job information to technician including directions, map
Planning Decisions • Planning decisions • Go through the thought process behind decisions • Understand the decisions made • Understand how you can apply • Your decisions may differ based on your priorities • Big Decisions • System architecture • Application design • Functionality • Resource Allocation
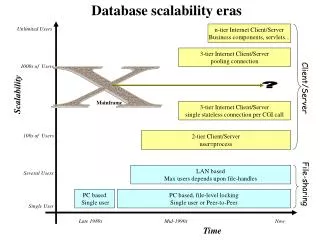
Legacy System Architecture Web Server Web Server ArcIMS ArcIMS Region 3 Client Region 1 Client Web Server Web Server ArcIMS ArcIMS Region 4 Client Region 2 Client
Initial System Architecture WebSphere Web ADF Region 3 Client Region 1 Client ArcGIS Server Region 2 Client Region 4 Client File Server
Final System Architecture WebSphere Web Services Region 3 Client Region 1 Client ArcGIS Server ArcGIS Server Region 2 Client Region 4 Client
Application Design • IBM/Java shop • Had existing Java web app for ArcIMS • Initial approach use Java Web ADF • Performance • Acceptable with few users • Not acceptable with hundreds • Caused by web server consolidation • Options • Add additional web servers with ADF • Web APIs • Use Java components in stateless manner • Used Stateless Java Components
Functional Planning • Map • Cached • Optimized • Check out “Effective Map Service” session • Data • Database, File Remote, File Local • Indexing (database) • Format (FGDB for file) • Geoprocessing • Local jobs directory
Functional Planning - Caching • Cached map • Initially wasn’t considered • Performance • Huge impact on map time generation • Moderate impact on overall transaction time • Cost • Add labor cost • Subtract hardware/software costs • Overall: Slight reduction in cost, but not significant • Decision to use caching
Request Time • Network time • West Coast: 40ms • New York: 80ms • Hong Kong: 200ms • SOAP handler: 10ms+ (depends on payload) • SOAP little faster than REST at 10 • SOM Queue Time • Requests are queued when all instances busy
Resource Allocation Planning • Context • 16 CPUs available on machines • 2 Services (cached map & network) • Network Service • Planned on 32 instances • Performance horrible • Too many instances • 16 instances optimal - 75% reduction in time • Cached Map Service • 0 or 1 instances? No. • Don’t forget query, identify, re-sampling & info • Ideal would be to have
Case: Performance Testing Eric Miller
Overview • What motivates the testing? • Test Environment • Test Methodology • What we learned • Service configuration tips • Server Framework observations • Recommendations for VMWare
What Motivates the Testing? • Regression testing during development • Performance • For various service types, data types and locations • Framework pieces - SOM/SOC/SOCMon/WS handlers • Service quality under load • Memory leaks • Response degradation (e.g. drawing errors) • Concurrency issues (e.g. hung processes - deadlocks). • Discovering optimal server architectures • Scalability • Redundancy/Fault tolerance
Test Environment • Hardware • PowerEdge M100E Blade Enclosure • 16 PowerEdge M600 blades • 2, quad-core, Intel(R) E5420 Xeon(R), 2.50GHz CPUs • 2x150GB 10K RPM, 3GBps Serial Attached SCSI in RAID 0 • 8 GB RAM • 2x 1GBps NIC cards • MD3000i iSCSI SAN Device • 4x400GB, 10K RPM, 3GBps • RAID 5 • PowerConnect 20 GbE Port Managed Switch (Separate Subnet) • Software • Visual Studio 2008 Team Test (controller and 4 agents) • SQL Server 2008 + Reporting Services
Test Methodology (overview) • What we measure Machine Performance MetricsService Metrics • CPU (% utilization) • Memory (available, per process) • Disk I/O (% idle time, bytes/sec) • Network (up/down, bytes/sec) • Average time per transaction • Throughput (transactions/hour) • Types of tests • Stress (step-load) • Durability (constant-load) • User-workflow (real-world) • More Information: ArcGIS Server Performance and Scalability - Testing Methodologies (W-10:15 AM, Th-3:15 PM, RM 31C)
Test Methodology: Stress Tests • Purpose: • Find maximum throughput with acceptable transaction time • Determine ratio of optimal service instances per core (sizing) • Procedure: • Step load test (fixed increments of clients/service instances) • Run each step for 5 minutes and record average throughput
Test Methodology: Durability Tests • Purpose: • Performance regression testing • Service quality (memory leaks, functional errors) • Determine long term stability (deadlocks) • Procedure: • Constant Load at 60% of maximum found in “Stress” tests. • Run for short times for regression and long for quality/stability Regression Quality/Stability
Test Methodology: User Workflow Tests • Purpose: Model and load test “real-world” user workflows • Procedure: • Record the workflow (including think time between requests) of a user interacting with multiple resources and operations from multiple services. • Determine acceptable transaction times for each step in the workflow and for the entire workflow. • Play back workflows in step load tests until acceptable transaction times are breached.
Test Methodology: User Workflow Tests Number of Users
What We Learned: Service Configuration Tips General – Data Format
What We Learned: Service Configuration Tips General – Request Return Type (MIME vs. URL) • MIME scales better than URL • Disk/UNC shares bottleneck before network bandwidth
What We Learned: Service Configuration Tips General – Data storage location • UNC/CIFS/SMB protocol has significant overhead • Try to store data locally when possible. • Penalty worsens with frequency of I/O
What We Learned: Service Configuration Tips Map – Setting Scale Dependency (reducing complexity)
What We Learned: Service Configuration Tips Map Caching – Compact Cache Production (Local Staging) • Enables linear scalability • Many times greater throughput
What We Learned: Service Configuration Tips Map Caching - Consumption • Access to compact caches is slightly slower than exploded • Access to caches – SOAP < REST < Virtual Directory
What We Learned: Service Configuration Tips Geocode, Network Analyst • Locator “runtime memory limit” has large impact • Balance between available RAM and load/unload from disk • Service warm-up required for optimal performance • Exercise service with most common routes before going live. • ArcScripts Java tool (scriptID 16873) pre-opens files in FGDB
What We Learned: Service Configuration Tips Image • Raster Format • Tiled, TIFF has greatest throughput • Compression
What We Learned: Service Configuration Tips Geoprocessing – Local Jobs Directory • Greatest single performance factor • 9.3.1/10.0 allow simple deployment
What We Learned: Framework Observations Web services handlers • LSASS optimization (.NET only) • By default every service request authenticates • Easy change to IIS application pool identity alleviates the issue. • Search for LSASS KB ID=32620 on resources.arcgis.com • Additional handlers guarantee SOC performance linearity
What We Learned: Framework Observations Software Network Load Balancers Scalability dependent on proper web server thread management • IIS worker process/CPU assignment ratio in web garden. • Apache threads configuration
What We Learned: Framework Observations SOM/SOC • SOM is difficult to bottleneck • 165 map draw requests/sec per core at 60% CPU • only add additional SOMs for redundancy • Use “Capacity” sparingly • Use only when reserving memory for non-ArcGIS Server processes. • Starting/stopping SOCs is less efficient than memory swapping. • 32 vs. 64 bit • ~5% improvement
What We Learned: Recommendations for VMWare Physical Machine: 4 CPU/16GB RAM Optimal Configuration 4 VMs, 1 CPU/VM, 2GB RAM/VM Physical Machine: 4 CPU/16GB RAM VM: 1 CPU/2GB RAM VM: 1 CPU/2GB RAM VM: 4 CPU/16GB RAM SOM SOC WS SOC SOM SOC WS VM: 1 CPU/2GB RAM VM: 1 CPU/2GB RAM PhysicalMachine: 4CPU/16GBRAM SOC SOC VM: 2 CPU/8GB RAM SOM SOC WS VM: 2 CPU/8GB RAM Physical Machine: 4 CPU/16GB RAM VM: 1 CPU/4GB RAM VM: 1 CPU/4GB RAM SOC SOM SOC WS SOC VM: 1 CPU/4GB RAM VM: 1 CPU/4GB RAM SOC SOC
What We Learned: Recommendations for VMWare Penalty of virtualization (Physical vs. various VM configs) 32% Degradation 11% Degradation
Performance Troubleshooting David Cordes
Agenda Case of the … • The Missing CPU • The Rollout
Case of the Missing CPU Why aren’t all my CPUs being used?
Case of the Rollout I don’t understand. It was fast in staging.