Download
1 / 85
850 likes | 871 Views
Explore age, gender, co-morbidities, and surgical practices from the National Cataract Surgery Registry's detailed data in 2003.

E N D
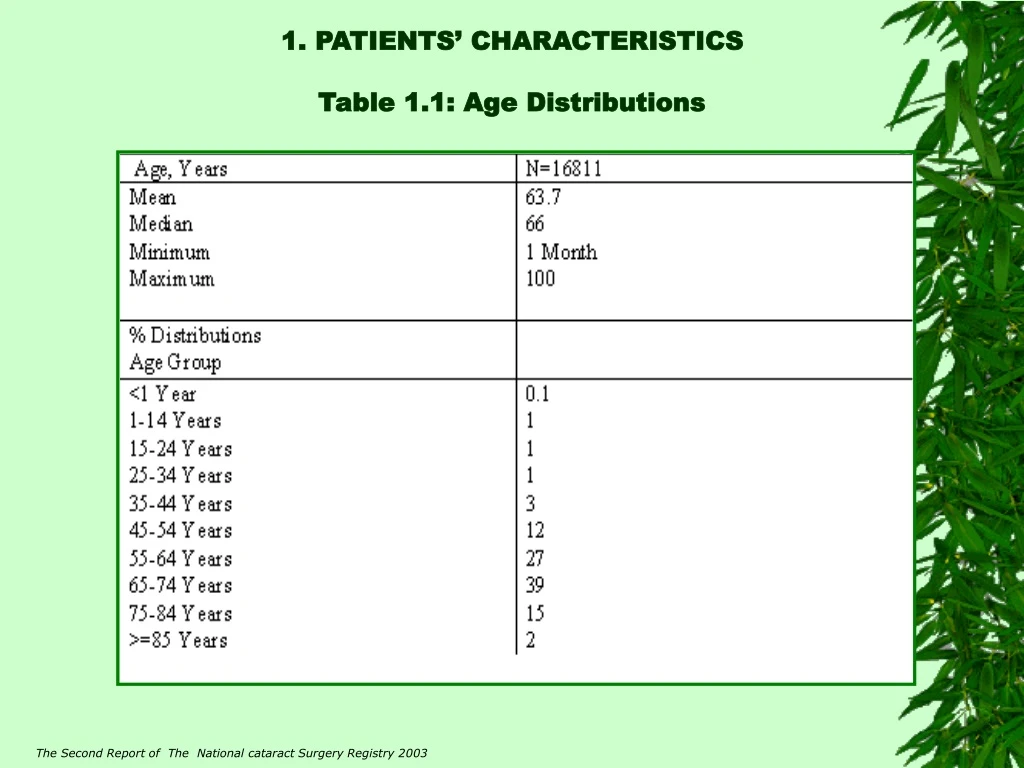
1. PATIENTS’ CHARACTERISTICSTable 1.1: Age Distributions The Second Report of The National cataract Surgery Registry 2003
percent 40 30 % 20 10 0 <1 15-24 35-44 55-64 75-84 1-14 25-34 45-54 65-74 >=85 Age group, years Figure 1.1: Age Distributions The Second Report of The National cataract Surgery Registry 2003
Table 1.2: Gender Distributions The Second Report of The National cataract Surgery Registry 2003
Table 1.3(a) : Number Of Patients With First Eye And Second Eye Surgery The Second Report of The National cataract Surgery Registry 2003
Table 1.3(b): Period Of Time Before Second Eye Surgery The Second Report of The National cataract Surgery Registry 2003
Table 1.4: Number Of Patients With Ocular Co-Morbidity The Second Report of The National cataract Surgery Registry 2003
Table 1.5: Number Of Patients With Systemic Co-Morbidity The Second Report of The National cataract Surgery Registry 2003
Table 1.6(a): Pre-Operative Visual Acuity Measurement The Second Report of The National cataract Surgery Registry 2003
Unaided Refracted 20 15 % 10 5 0 6/5 6/9 6/18 6/36 5/60 3/60 1/60 HM NPL 6/6 6/12 6/24 6/60 4/60 2/60 CF PL Visual acuity Figure 1.6: Pre-Operative Visual Acuity Measurement The Second Report of The National cataract Surgery Registry 2003
Table 1.6(b): Pre-Operative Visual Acuity Measurement By Gender The Second Report of The National cataract Surgery Registry 2003
Table 1.7: Causes Of Cataract The Second Report of The National cataract Surgery Registry 2003
2. CATARACT SURGICAL PRACTICES Table 2.1: Number (%) Of Surgery Done By Month The Second Report of The National cataract Surgery Registry 2003
Figure 2.1: Number (%) Of Surgery number 2000 1500 1000 No. of surgeries 500 0 January March May July September November February April June August October December Month The Second Report of The National cataract Surgery Registry 2003
Table 2.2: Number Of Surgery Done By Centre, 2002 And 2003 The Second Report of The National cataract Surgery Registry 2003
Year 2002 Year 2003 1500 1000 No. of surgeries 500 0 A C E G I K M O Q S U W Y AA AC AE AG B D F H J L N P R T V X Z AB AD AF Centre Figure 2.2: Number Of Surgery Done By Center The Second Report of The National cataract Surgery Registry 2003
Table 2.3: Distribution Of Day Care Setting By Centre, All Surgery And Those Excluded Children Below 18 Years And Combined Surgery The Second Report of The National cataract Surgery Registry 2003
Average day care (all patients)=37% Day care In-patient 100 % 50 37 0 J C AF U AD D W L B S G Q AB K H I R N AA E V A 0 P AC T M X Y F Z AE Centre Figure 2.3(a): Distribution Of Day Care And In Patient By Centre, Year 2003 The Second Report of The National cataract Surgery Registry 2003
Average day care (all patients)=38% Day care In-patient 100 % 50 38 0 AF R C U E V W L B T G M Y F Z I N J AA AD A D 0 P AC S Q X K AB H AE Centre Figure 2.3(b): Distribution Of Day Care And In Patient By Centre (Exclude Children And Those With Combined Surgery), Year 2003 The Second Report of The National cataract Surgery Registry 2003
Table 2.4: Distribution Of Types Of Cataract Surgery By Centre The Second Report of The National cataract Surgery Registry 2003
Table 2.5: Distribution Of Combined Surgery By Centre The Second Report of The National cataract Surgery Registry 2003
Table 2.6: Proportion Of Nature Of Cataract Surgery The Second Report of The National cataract Surgery Registry 2003
Table 2.7: Type Of Anaesthesia The Second Report of The National cataract Surgery Registry 2003
Average of local anesthesia =93% Local General 100 93 % 50 0 N T D Y X F V 0 Q W H I J AB A P G U M S AA B C AC K AD L E AF Z R AE Centre Figure 2.7: Type Of Anaesthesia The Second Report of The National cataract Surgery Registry 2003
Table 2.8: Type Of Local Anaesthesia The Second Report of The National cataract Surgery Registry 2003
Table 2.9: Distribution Of Single And Multiple Local Anaesthesia The Second Report of The National cataract Surgery Registry 2003
Table 2.10: Type Of Sedation Given To Patient Who Had Local Anaesthesia The Second Report of The National cataract Surgery Registry 2003
Table 2.11: Intraocular Lens Implantation 2.11(a) IOL Implantation The Second Report of The National cataract Surgery Registry 2003
2.11(b) Distribution Of IOL Placement The Second Report of The National cataract Surgery Registry 2003
Table 2.12: Distribution Of Cataract Surgery Without IOL The Second Report of The National cataract Surgery Registry 2003
Table 2.13: Distribution Of IOL- Materials And Types The Second Report of The National cataract Surgery Registry 2003
3. CATARACT SURGERY OUTCOMES3.1 Cataract Surgery Complications - Intra-OperativeTable 3.1.1: Distribution Of Intra-Operative Complications By Type Of Cataract Surgery * Number In Each Column Might Add Up To Be More Than That Recorded At Row With ‘ Any Intra-Op Complication’ As One Patient Might Have More Than One Type Of Intra-Operative Complications. The Second Report of The National cataract Surgery Registry 2003
All surgeries 10 % 5 0 Any 2 4 6 8 1 3 5 7 Intra-operative complication Figure 3.1.1.1 Distribution Of Intra-Operative Complication Intra-Operative Complication: Index Refers To Table 3.1.1 The Second Report of The National cataract Surgery Registry 2003
Figure 3.1.1.2: Distribution Of Intra-Operative Complication By Posterior Capsule Rupture With Vitreous Loss And Posterior Capsule Rupture Without Vitreous Loss PCR with vitreous loss PCR without vitreous loss 30 20 % 10 0 LA ECCE PE PE to ECCE ICCE 2 IOL Implant Type of cataract surgery LA=Lens Aspiration 2 IOL Implant=Secondary IOL Implant The Second Report of The National cataract Surgery Registry 2003
Figure 3.1.1.3: Distribution Of Intra-Operative Complication By Zonular Dialysis With Vitreous Loss And Zonular Dialysis Without Vitreous Loss ZD with vitreous loss ZD without vitreous loss 20 15 % 10 5 0 LA ECCE PE PE to ECCE ICCE 2 IOL Implant Type of cataract surgery LA=Lens Aspiration 2 IOL Implant=Secondary IOL Implant The Second Report of The National cataract Surgery Registry 2003
Table 3.1.2: Distribution Of Intra-Operative Complications By Combined Surgery *Number In Each Column Might Add Up To Be More Than That Recorded At Row With ‘ Any Intra-Operative Complication’ As One Patient Might Have More Than One Type Of Intra-Operative Complications The Second Report of The National cataract Surgery Registry 2003
Table 3.1.3: Distribution Of Intra-Operative Complications By Nature Of Cataract Surgery The Second Report of The National cataract Surgery Registry 2003
Figure 3.1.3: Distribution Of Intra-Operative Complications By Nature Of Cataract Surgery Emergency Elective 20 15 % 10 5 0 Any 2 4 6 8 1 3 5 7 Intra-operative complication Intra-Op Complication: Index Refers To Table 3.1.3 The Second Report of The National cataract Surgery Registry 2003
Table 3.1.4: Distribution Of Intra-Operative Complications By Type Of Anaesthesia The Second Report of The National cataract Surgery Registry 2003
Figure 3.1.4: Distribution Of Intra-Operative Complications By Type Of Anaesthesia General Local 10 % 5 0 Any 2 4 6 8 1 3 5 7 Intra-operative complication Intra-Op Complication: Index Refers To Table 3.1.4 The Second Report of The National cataract Surgery Registry 2003
Table 3.1.5: Distribution Of Intra-Operative Complications By Type Of Local Anaesthesia * Number In Each Column Might Add Up To Be More Than That Recorded At Row With ‘ Any Intra-Op Complication’ As One Patient Might Have More Than One Type Of Intra-Operative Complications The Second Report of The National cataract Surgery Registry 2003
Table 3.1.6: Distribution Of Intra-Operative Complications By Single Or Multiple Local Anaesthesia The Second Report of The National cataract Surgery Registry 2003
Figure 3.1.6: Distribution Of Intra-Operative Complications By Single Or Multiple Local Anaesthesia Single anaesthesia Multiple anaesthesia 15 10 % 5 0 Any 2 4 6 8 1 3 5 7 Intra-operative complication Intra-Op Complication: Index Refers To Table 3.1.6 The Second Report of The National cataract Surgery Registry 2003
Table 3.1.7: Distribution Of Intra-Operative Complications By Type Of Sedation * Number In Each Column Might Add Up To Be More Than That Recorded At Row With ‘ Any Intra-Op Complication’ As One Patient Might Have More Than One Type Of Intra-Operative Complications The Second Report of The National cataract Surgery Registry 2003
No sedation Oral Intravenous Intravenous plus oral Intramuscular 20 15 10 % 5 0 Any 2 4 6 8 1 3 5 7 Intra-operative complication Figure 3.1.7: Distribution Of Intra-Operative Complications By Type Of Sedation Intra-Op Complication: Index Refers To Table 3.1.7 The Second Report of The National cataract Surgery Registry 2003
Table 3.1.8: Distribution Of Intra-Operative Complications By Sedation The Second Report of The National cataract Surgery Registry 2003
No Sedation Single Sedation Multiple Sedation 10 % 5 0 Any 2 4 6 8 1 3 5 7 Intra-operative complication Figure 3.1.8: Distribution Of Intra-Operative Complications By Sedation Intra-Op Complication: Index Refers To Table 3.1.8 The Second Report of The National cataract Surgery Registry 2003
Table 3.1.9: Distribution Of Intra-Operative Complications By Cataract Surgery With IOL The Second Report of The National cataract Surgery Registry 2003
Posterior Anterior Scleral 80 60 % 40 20 0 Any 2 4 6 8 1 3 5 7 Intra-operative complication Figure 3.1.9: Distribution Of Intra-Operative Complications By Cataract Surgery With IOL Intra-Op Complication: Index Refers To Table 3.1.09 The Second Report of The National cataract Surgery Registry 2003
Table 3.1.10: Distribution Of Intra-Operative Complications By Cataract Surgery Without IOL The Second Report of The National cataract Surgery Registry 2003
IOL Planned No IOL was planned 80 60 % 40 20 0 Any 2 4 6 8 1 3 5 7 Intra-operative complication Figure 3.1.10: Distribution Of Intra-Operative Complications By Cataract Surgery Without IOL Intra-Op Complication: Index Refers To Table 3.1.10 The Second Report of The National cataract Surgery Registry 2003