Download
1 / 37
390 likes | 689 Views
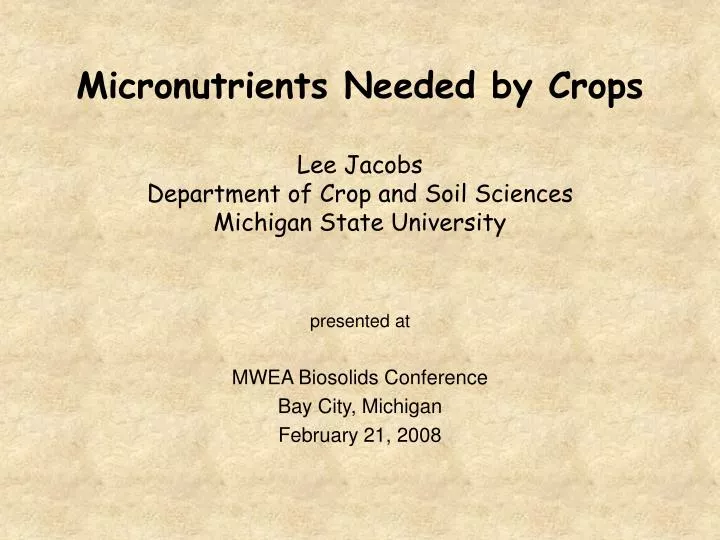
Micronutrients Needed by Crops Lee Jacobs Department of Crop and Soil Sciences Michigan State University. presented at MWEA Biosolids Conference Bay City, Michigan February 21, 2008. Classification of the Essential Nutrients for Plant Growth. Macronutrients C, H, O from air and water

E N D
Micronutrients Needed by CropsLee JacobsDepartment of Crop and Soil SciencesMichigan State University • presented at • MWEA Biosolids Conference • Bay City, Michigan • February 21, 2008
Classification of the Essential Nutrients for Plant Growth Macronutrients C, H, O from air and water N, P, K, Ca, Mg, S from soil Primary Secondary Micronutrients Fe, B, Mn, Cu, Zn, Mo, Cl, Ni from soil
Essential Major Elements – Plants/Animals • Major Plant NutrientsMajor Animal Nutrients • Carbon (C) Carbon (C) • Hydrogen (H) Hydrogen (H) • Oxygen (O) Oxygen (O) • Nitrogen (N) Nitrogen (N) • Phosphorus (P) Sulfur (S) • Potassium (K) Calcium (Ca) • Calcium (Ca) Phosphorus (P) • Magnesium (Mg) Potassium (K) • Sulfur (S) Magnesium (Mg) • Sodium (Na) • Chlorine (Cl)
Essential Trace Elements – Plants/Animals* • Trace Plant NutrientsTrace Animal Nutrients • Boron (B) Copper (Cu) • Copper (Cu) Iron (Fe) • Iron (Fe) Manganese (Mn) • Manganese (Mn) Molybdenum (Mo) • Molybdenum (Mo) Zinc (Zn) • Zinc (Zn) Arsenic (As) • Chlorine (Cl) Chromium (Cr) • Nickel (Ni) Cobalt (Co) • Flourine (F) • Essential for Some PlantsIodine (I) • Cobalt (Co) Nickel (Ni) • Silicon (Si) Selenium (Se) • Sodium (Na) Silicon (Si) • Vanadium (V) Tin (Sn) • Vanadium (V) * Plants will not only absorb essential plant and animal elements, but many non-essential elements found in soils are also found in plant tissue ash.
Nutrient Levels in Plants • Terms used to describe nutrient levels in plants: • Deficient – when the concentration of an essential element is low enough to severely limit yield • Critical range – nutrient concentration in plant below which a yield response occurs when the essential nutrient is added • Sufficient (optimal) – nutrient concentration range when the yield will not increase when more of the essential nutrient is added, but plant tissue concentration can increase • Excessive (toxic) – when the concentration of an essential, or non-essential, element is high enough to reduce plant growth and yield
(a) (b) Figure 2.5. Typical dose-response curves for (a) essential elements (macronutrients & micronutrients) and (b) non-essential elements. (Alloway,1995, p. 31)
(1% = 10,000 ppm) Havlin et al.,2005, p. 12
Quantities of Micronutrients Needed • 1) While micronutrients are required by a plant for growth, the amount needed is small in comparison to macro nutrients (N, P, K). • 2) Nevertheless, deficiency of a micronutrient can be just as yield limiting as the deficiency of a macronutrient.
Micronutrients • Form Taken Major Concentration • Elementup by plantsSource in plants (avg) • Chloride (Cl) Cl- Precipitation 100 ppm • Salts • Iron (Fe) Fe2+, Fe3+ Soil minerals 100 ppm • Manganese (Mn) Mn2+ Soil minerals 50 ppm • Zinc (Zn) Zn2+ Soil minerals, 20 ppm • organic matter • Boron (B) H3BO3 Organic matter 20 ppm • Copper (Cu) Cu2+ Soil minerals 6 ppm • organic matter • Molybdenum (Mo) MoO42- Soil minerals 0.1 ppm • Nickel (Ni) Ni2+ Soil minerals 0.01 ppm
For optimum availability of all essential plant nutrients, usually want to maintain soil pH at 6.5 or above by liming, but soil pH should be kept below 7.0.
Typical Concentrations in Soils • MicronutrientRangeAverage • Iron (Fe2+, Fe3+) 0.5 – 50% 3 – 4% • Manganese (Mn2+) 20 – 3,000 ppm 600 ppm • Nickel (Ni2+) 2 – 750 ppm 50 ppm • Zinc (Zn2+) 10 – 300 ppm 50 ppm • Copper (Cu2+) 2 – 100 ppm 9 ppm • Boron (H3BO3) 2 – 200 ppm 50 ppm • Molybdenum (MoO42-) 0.2 – 5.0 ppm 1.2 ppm • Chloride (Cl-) highly variable
Similar cycles occur for each of the cationic micronutrients, as shown above for Fe2+ and Fe3+, except only divalent forms of Mn2+, Zn2+, Cu2+, and Ni2+ are taken up by plants. Havlin et al., 2005, p. 245
Fe and Mn in Soils • 1) Solubility of Fe minerals is very low in soils, so Fe3+ in solution is very low and much higher than Fe2+ in well-drained, oxidized soils across common soil pH’s. • 2) Under waterlogged conditions, Fe3+ can be reduced to Fe2+ • 2 Fe2O3 4 FeO + O2 • 3) Mn2+ is common in soil solution, but concentrations decrease as pH increases. • 4) Mn2+ concentration controlled mostly by MnO2, w/ ~90% of the Mn2+ organically complexed (chelated); Mn2+ in solution can increase under acid, reducing conditions • 5) Natural organic compounds in soil, or synthetic compounds added to soils can complex (chelate) Fe3+, which can increase Fe in the soil solution and transport to roots by mass flow and diffusion.
MSU Extension Bulletin E-486
Table 1. Micronutrient sufficiency ranges in diagnostic tissue of selected crops.** • Element Corn Wheat Alfalfa Soybeans Potatoes Sugar Beets • - - - - - - - - - - ppm - - - - - - - - - - • Boron (B) 4-25 6-40 31-80 21-55 15-40 26-80 • Copper (Cu) 6-20 6-50 11-30 10-30 7-30 11-40 • Iron (Fe) 21-250 11-300 31-250 51-350 30-300 51-200 • Manganese (Mn) 20-150 16-200 31-100 21-100 30-200 21-150 • Molybdenum (Mo) 0.1-2.0 0.03-5.0 1.0-5.0 1.0-5.0 0.5-4.0 0.15-5.0 • Zinc (Zn) 20-70 21-70 21-70 21-50 30-100 19-60 • Chloride (Cl) 2,000-20,000 (0.2-2.0%) • Nickel (Ni) 0.1-1.0 • ** Ranges taken from MSU Bulletin E-486, page 2, except general range for Cl and Ni taken from Havlin et al, 2005.
Fe Deficiency Symptoms andToxicity in Plants • 1) Plants contain 11-350 ppm. Deficiency not common for field and vegetable crops grown on soils with pH <7.0 • 2) Fe is very immobile in plants, so deficiency symptoms appear in young leaves, causing stunted growth. • 3) Young leaves develop interveinal chlorosis, similar to Mn deficiency. • 4) Under severe Fe deficiency, leaves turn white and eventually die (necrosis). • 5) Fe toxicity where plants accumulate >300 ppm can occur when pH is <5.0 and where soils are contaminated w/ soluble Fe salts.
Figure 23. Iron-deficient corn. Light yellowing of the terminal leaves, with interveinal chlorosis of the leaves similar to that caused by Mn deficiency. Seldom found in Michigan field crops. More commonly found in woody plants, ornamental and turf crops. (Bull. E-486, p. 14)
Fe deficiency in a fescue lawn. (personal communication, J.L. Havlin)
Mn Deficiency Symptoms andToxicity in Plants • 1) Plants contain 20-200 ppm Mn (normal), usually deficient if <20 ppm, and usually toxic if >300 ppm. • 2) Mn deficiency usually found on slightly acid (pH 6.6-7.0) or alkaline soils (pH >7.0); may also occur when: • a) pH >5.8 on organic soils & black sands • b) pH >6.5 on mineral soils • 2) Mn is immobile in plants, so deficiency symptoms appear in young leaves. • 3) Young leaves develop interveinal chlorosis, similar to Fe deficiency. • 4) Mn toxicity occurs in sensitive crops grown on acid soils; liming can readily correct this problem – in tissue, Mn concentrations >300 ppm can be toxic
Figure 4. Manganese-deficient dark red kidney beans. Yellowing between the leaf veins. Veins remain green. (Bull. E-486, p. 7)
Typical Concentrations in Soils • MicronutrientRangeAverage • Iron (Fe2+, Fe3+) 0.5 – 50% 3 – 4% • Manganese (Mn2+) 20 – 3,000 ppm 600 ppm • Nickel (Ni2+) 2 – 750 ppm 50 ppm • Zinc (Zn2+) 10 – 300 ppm 50 ppm • Copper (Cu2+) 2 – 100 ppm 9 ppm • Boron (H3BO3) 2 – 200 ppm 50 ppm • Molybdenum (MoO42-) 0.2 – 5.0 ppm 1.2 ppm • Chloride (Cl-) highly variable
Similar cycles occur for Cu2+ and Ni2+, as shown above for Zn2+, to release divalent ions of each metal into the soil solution for uptake by plants. Havlin et al., 2005, p. 256
Zn, Ni and Cu in Soils • 1) Soil solution Zn2+, Ni2+, and Cu2+ is low; Zn, Ni and Cu solubility is pH dependent, as shown in the figure earlier. • 2) Organic complexed (chelated) forms of Zn2+, Ni2+, and Cu2+ can increase the concentrations of each metal in the soil solution to increase their diffusion to roots for plant uptake.
Zn, Ni and Cu in Soils • 1) Soil solution Zn2+, Ni2+, and Cu2+ is low; Zn, Ni and Cu solubility is pH dependent, as shown in the figure above. • 2) Organic complexed (chelated) forms of Zn2+, Ni2+, and Cu2+ can increase the concentrations of each metal in the soil solution to increase their diffusion to roots for plant uptake. • 3) Availability of Cu is more strongly controlled by soil organic matter (SOM). At <8% SOM, Cu is adsorbed to organic & mineral surfaces, but at >8% SOM, Cu is adsorbed mostly on organic surfaces. Therefore, Cu deficiency is frequent w/ peat & muck soils.
Zn and Ni Deficiency Symptoms and Toxicity in Plants • 1) Zn deficiency is usually found on soils that are a) acidic sandy soils low in Zn, b) neutral, basic, or calcareous soils, and c) soils with high available P. Ni deficiency is seldom observed due to low plant requirements. • 2) Zn and Ni are not readily translocated, so deficiency symptoms first appear in young leaves. • 3) Zn and Ni toxicity can occur on acid soils, pH <5.0, and/or where soils are contaminated with soluble Zn or Ni salts. • 4) Zn concentrations are normally 20-150 ppm with <20 ppm being deficient and >300 ppm being toxic. • 5) Ni concentrations are normally 0.1-1.0 ppm with >50 ppm usually toxic. However, some plants are hyperaccumulators of Ni and leaves of these plants can contain >1,000 ppm w/o toxicity.
Figure 13. Zinc-deficient corn. Yellow or white striping of the leaves usually developing near the stalk. Plants are often stunted with shortened internodes. Found most often on high pH soils and organic soils. (Bull. E-486, p. 10)
Cu Deficiency Symptoms and Toxicity in Plants • 1) Cu deficiencies are not as common as other micronutrients but can occur in sensitive crops on low-Cu soils, because most soils in Michigan have sufficient Cu. Peaty soils are generally the only soils that can be deficient in Cu. • 2) Cu is not readily translocated, so deficiency symptoms first appear in young leaves. • 3) Cu toxicity is uncommon but can occur where soils are contaminated with high Cu materials or repeated use of Cu-containing pesticides. • 4) Plants contain 6-50 ppm Cu with 5-20 ppm being normal, <6 ppm usually deficient, and >150 ppm usually toxic.
Typical Concentrations in Soils • MicronutrientRangeAverage • Iron (Fe2+, Fe3+) 0.5 – 50% 3 – 4% • Manganese (Mn2+) 20 – 3,000 ppm 600 ppm • Nickel (Ni2+) 2 – 750 ppm 50 ppm • Zinc (Zn2+) 10 – 300 ppm 50 ppm • Copper (Cu2+) 2 – 100 ppm 9 ppm • Boron (H3BO3) 2 – 200 ppm 50 ppm • Molybdenum (MoO42-) 0.2 – 5.0 ppm 1.2 ppm • Chloride (Cl-) highly variable
A similar cycle occurs for H3BO3 and MoO42- as for Cl-. Note that leaching is a possible pathway; however, no H3BO3 and MoO42- inputs from rain occur, as occurs with Cl-. Havlin et al., 2005, p. 280
B, Mo and Cl in Soils • 1) Total B in soils varies between 2-200 ppm, while total Mo in soils typically ranges between 0.2-5 ppm. Nearly all Cl- in soils exists in the soil solution, which ranges in concentration from 0.5 ppm in acid soils to >6,000 ppm in saline/sodic soils. • 2) H3BO3 is the predominant form in soil solution at pH range of 5 to 9. Organically complexed B is the largest potential source of plant available B in soils, which increases w/ increasing SOM. • 3) MoO42-, HMoO4-, and H2MoO4 are forms found in soil solution with MoO42- and HMoO4- concentrations increasing as soil pH increases. • 4) Cl in soils behaves very similar to NO3-, being very soluble and readily leaches.
B, Mo and Cl Deficiency Symptoms and Toxicity in Plants • 1) B deficiency is usually found on sandy soils, organic soils & some fine-textured lake bed soils (w/ alkaline subsoils). Very few soils in MI have need for Mo additions, except for peats, acid sandy soils & organic soils w/ large amounts of bog Fe. Deficiency of Cl is rare. • 2) B and Mo are immobile in plants, so deficiency symptoms appear in young leaves. • 3) B toxicity is uncommon in most arable soils, unless excess amounts are added by fertilizers or contamination. Plants normally contain 20-100 ppm B with <15 ppm usually being deficient and >200 ppm usually being toxic.
B, Mo and Cl Deficiency Symptoms and Toxicity in Plants (cont’d) • 4) Plants normally contain 0.8-15 ppm Mo with <0.5 ppm usually being deficient. Plants appear quite tolerant of high soil Mo, so there are no recordings of Mo toxicity under field conditions. However, excess amounts of Mo in forages are toxic to animals causing molybdenosis, a disease in cattle. • 5) Plants normally contain 0.5-2.0% Cl (5,000-20,000 ppm) with <70-700 ppm usually indicative of deficiency. Concentrations up to 2.0% can be toxic for sensitive plants and >4.0% can be toxic for tolerant plants, although levels as high as 10% do occur with some salt-tolerant plants.
Soil Testing and Fertilizer Additions of Micronutrients • 1) In Michigan, soil testing can be done for B, Cu, Fe, Mn and Zn to check for adequate availability of these nutrients for plant growth. • 2) When availability is low, the following are rates normally recommended for crops that are: • nutrienthighly responsivemedium responsive • B 1.5 - 3.0 lb/ac 0.5 – 1.0 lb/ac • Cu 3 – 6 lb/ac (organic soils) 1.5 – 3.0 lb/ac • Fe (foliar spray usually used at 0.5 – 1.0 lb/ac) • Mn (4 – 8 lb/ac for mineral, 8 – 16 lb/ac for organic soils) • Zn (3-5 lb/ac for soil pH>7.5, 2-3 lb/ac for soil pH 6.7-7.4)