
Modeling Solar Activity Effects on Greek Grid
Explore how solar storms impact the Greek national electric grid through geomagnetically induced currents. Understand short and long-term effects on transformers using data analysis and models.

Modeling Solar Activity Effects on Greek Grid
E N D
Presentation Transcript
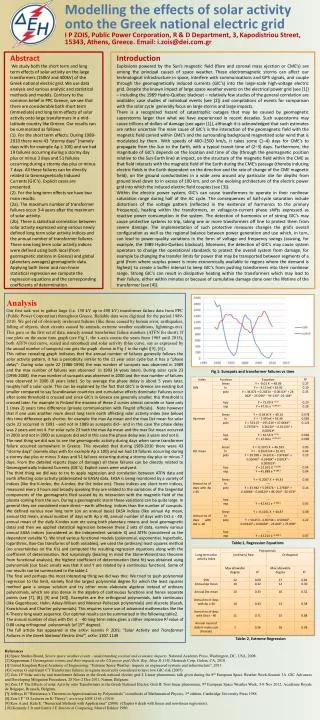
Modelling the effects of solar activity onto the Greek national electric gridI P ZOIS, Public Power Corporation, R & D Department, 3, Kapodistriou Street, 15343, Athens, Greece. Email: i.zois@dei.com.gr • Introduction • Explosions powered by the Sun’s magnetic field (flare and coronal mass ejection or CME’s) are among the principal causes of space weather. These electromagnetic storms can affect our technological infrastructure in space, interfere with communications and GPS signals, and couple through the geomagnetically induced currents (GIC’s) into the large-scale high-voltage electric grid. Despite the known impact of large space weather events on the electrical power grid (see [1]) – including the 1989 Hydro-Québec blackout – relatively few studies of the general correlation are available; case studies of individual events (see [2]) and compilations of events for comparison with the solar cycle generally focus on large storms and large impacts. • There is a recognized hazard of catastrophic outages that may be caused by geomagnetic superstorms larger than what we have experienced in recent decades. Such superstorms may cause trillions of dollars of damage (see again [1]), although it is acknowledged that such estimates are rather uncertain The main cause of GIC’s is the interaction of the geomagnetic field with the magnetic field carried within CME’s and the surrounding background magnetized solar wind that is modulated by them. With speeds of 400–2500 km/s, it takes some (1–4) days for CME’s to propagate from the Sun to the Earth, with a typical transit time of (2–3) days. Furthermore, the magnitude of GIC’s depends on the location and time of day (through the geomagnetic position relative to the Sun-Earth line) at impact, on the structure of the magnetic field within the CME as that field interacts with the magnetic field of the Earth during the CME’s passage (thereby inducing electric fields in the Earth dependent on the direction and the rate of change of the CME magnetic field), on the ground conductivities in a wide area around any particular site for depths from ground level down to in excess of 100 km, and on the evolving architecture of the electric power grid into which the induced electric field couples (see [3]). • Within the electric power system, GIC’s can cause transformers to operate in their nonlinear saturation range during half of the AC cycle. The consequences of half-cycle saturation include distortions of the voltage pattern (reflected in the existence of harmonics to the primary frequency), heating within the transformers, or voltage-to-current phase shifts expressed as reactive power consumption in the system. The detection of harmonics or of strong GIC’s may cause protective systems to trip, taking one or more transformers off line to protect them from severe damage. The implementation of such protective measures changes the grid’s overall configuration as well as the regional balance between power generation and use which, in turn, can lead to power-quality variations in the form of voltage and frequency swings (causing, for example, the 1989 Hydro-Québec blackout). Moreover, the detection of GIC’s may cause system operators to change the operational standards to protect the overall system from damage, for example by changing the transfer limits for power that may be transported between segments of a grid (from where surplus power is more economically available to regions where the demand is highest) to create a buffer interval to keep GIC’s from pushing transformers into their nonlinear range. Strong GIC’s can result in dissipative heating within the transformers which may lead to their failure, either within minutes or because of cumulative damage done over the lifetime of the transformer (see [4]). AbstractWe study both the short term and long term effects of solar activity on the large transformers (150kV and 400kV) of the Greek national electric grid. We use data analysis and various analytic and statistical methods and models. Contrary to the common belief in PPC Greece, we see that there are considerable both short term (immediate) and long term effects of solar activity onto large transformers in a mid-latitude country like Greece. Our results can be summarized as follows: (1). For the short term effects: During 1989-2010 there were 43 “stormy days” (namely days with for example Ap ≥ 100) and we had 19 failures occurring during a stormy day plus or minus 3 days and 51 failures occurring during a stormy day plus or minus 7 days. All these failures can be directly related to Geomagnetically Induced Currents (GIC’s). Explicit cases are presented. (2). For the long term effects we have two main results: (2a). The maximum number of transformer failures occur 3-4 years after the maximum of solar activity.(2b). There is statistical correlation between solar activity expressed using various newly defined long term solar activity indices and the annual number of transformer failures. These new long term solar activity indices were defined using both local (from geomagnetic stations in Greece) and global (planetary averages) geomagnetic data. Applying both linear and non-linear statistical regression we compute the regression equations and the corresponding coefficients of determination. Analysis Our first task was to gather large (i.e. 150 kV up to 400 kV) transformer failure data from PPC (Public Power Corporation) throughout Greece. Reliable data were digitized for the period 1989-2010. We got rid of obviously irrelevant failures (like those caused by human error, earthquakes, falling of objects, short circuits caused by animals, extreme weather conditions, lightnings etc). This gave us the first set of data, namely annual transformer failure numbers (ATFN for short). If one plots on the same time graph (see Fig 1, the x-axis counts the years from 1985 until 2015), both ATFN (red curve, scaled and smoothed) and solar activity (blue curve, say as expressed by the annual number of sunspots) one gets the graph shown in Fig 1 to the right ([5], [6]): • This rather revealing graph indicates that the annual number of failures generally follows the solar activity pattern, it has a periodicity similar to the 11 year solar cycle but it has a “phase delay”: During solar cycle 22 (1986-1996) the max number of sunspots was observed in 1989 and the max number of failures was observed in 1993 (4 years later). During solar cycle 23 (1996-2008) the max number of sunspots was observed in 2000 and the max number of failures was observed in 2006 (6 years later). So by average the phase delay is about 5 years later, roughly half a solar cycle. This can be explained by the fact that GIC’s in Greece are existing but smaller compared to say Scandinavian countries and cumulative effects dominate: Failures occur after some threshold is crossed and since GIC’s in Greece are generally smaller, this threshold is crossed later. For example in Finland the maxima of these 2 curves almost coincide or have only 1 (max 2) years time difference (private communication with Fingrid officials). Note however that if one uses another more direct long term earth affecting solar activity index (see below) this time difference gets shorter, for example the max Ap mean and the max Dst mean for solar cycle 22 occurred in 1991 --and not in 1989 as sunspots did-- and in this case the phase delay was 2 years and not 4. For solar cycle 23 both the max Ap mean and the max Dst mean occurred in 2003 and not in 2000 as sunspots did and in this case the phase delay was 3 years and not 6. • The next thing we did was to see the geomagnetic activity during days when some transformer failure occurred somewhere in Greece. This revealed that during 1989-2010 there were 43 “stormy days” (namely days with for example Ap ≥ 100) and we had 19 failures occurring during a stormy day plus or minus 3 days and 51 failures occurring during a stormy day plus or minus 7 days. From the detailed reports (type of damage) all these failures can be directly related to Geomagnetically Induced Currents (GIC’s). Explicit cases were analysed. • The third thing we did was to try to apply regression and correlation between ATFN data and earth affecting solar activity (abbreviated to EASA) data. EASA is being monitored by a variety of indices (like the K-index, the A-index, the Dst index etc). These indices are short term indices, measured every 3 hours and broadly speaking they are related to the variations of the tangential components of the geomagnetic filed caused by its interaction with the magnetic field of the plasma coming from the sun. During a geomagnetic storm these variations can be quite large. In general they are considered more direct—earth affecting indices than the number of sunspots. We defined various new long term (on an annual basis) EASA indices (like annual Ap mean, annual Dst mean, annual number of days with Ap ≥ 40, annual number of days with Dst ≤ - 40, annual mean of the daily K-index sum etc using both planetary means and local geomagnetic data) and then we applied statistical regression between these 2 sets of data, namely various annual EASA indices (considered as the independent variable X) and ATFN (considered as the dependent variable Y). We tried various functional models (polynomial, exponential, hyperbolic, logarithmic, Box-Cox transforms of both variables), we used the (ordinary) least squares method (no uncertainties on the X’s) and computed the resulting regression equations along with the coefficient of determination. Not surprisingly (bearing in mind the Stone-Weierstrass theorem from functional analysis), the highest coefficient of determination (best fit) was obtained using polynomials (our basic ansatz was that X and Y are related by a continuous function). Some of our results can be summarized in the table:1 • The final and perhaps the most interesting thing we did was this: We tried to push polynomial regression to the limit, namely find the largest polynomial degree for which the least squares method gave a unique solution and try other more elaborate algebras instead of ordinary polynomials, which are also dense in the algebra of continuous functions and hence separate points (see [7], [8], [9] and [10]). Examples are the orthogonal polynomials, both continuous (like Gegenbauer, Hahn, Askey-Wilson and Meixner-Pollaczek polynomials) and discrete (Racah, Krawtchouk and Charlier polynomials). This requires some use of advanced mathematics like the K-Theory long exact sequence. Our optimal results can be summarized in the following table2. • The annual number of days with Dst ≤ - 40 long term index gives a rather impressive R2value of 0.88 using orthogonal polynomials (of 15th degree). • The full article has appeared in the arXiv: Ioannis P. ZOIS: “Solar Activity and Transformer Failures in the Greek National Electric Grid”, arXiv: 1307.1149 Fig 1: Sunspots and transformer failures vs time Table:1, Regression Equations Table: 2, Extreme Regression References [1] Space Studies Board, Severe space weather events – understanding societal and economic impacts. National Academy Press, Washington, DC, USA, 2008. [2] Kappenman J Geomagnetic storms and their impacts on the US power grid (Tech. Rep. Meta-R-319), Metatech Corp, Goleta, CA, 2010. [3] United Kingdom Royal Academy of Engineering: “Extreme Space Weather: impacts on engineered systems and infrastructure”, 2013 [4]Coetzee G and Gaunt CT Transformer failures in regions incorrectly considered to have low GIC-risk (2007) [5] Zois I P Solar activity and transformer failures in the Greek national electric grid I: Linear phenomena, talk given during the 8th European Space Weather Week-Session 3A GIC Advances and Developing Mitigation Procedures, 28 Nov-2 Dec 2011, Namur, Belgium. [6] Zois I P The Effects of solar Activity onto Transformers in the Greek National Electric Grid II: Non-linear phenomena, 9th European Space Weather Week, 5-9 Nov 2012, Académie Royale de Belgique, Brussels, Belgium. [7]Jeffreys H “Weierstrass‘s Theorem on Approximations by Polynomials” in methods of Mathematical Physics, 3rd edition, Cambridge University Press 1988. [8] Zois I P “18 Lectures on K-Theory”, arxiv.org 1008.1346, (2010) [9] Kaw A and Kalu E. "Numerical Methods with Applications" (2008) (Chapter 6 deals with linear and non-linear regression). [10] Kennedy J Jr and Gentle J E Statistical Computing, Marcel Dekker 1980.


