Download
1 / 17
170 likes | 300 Views
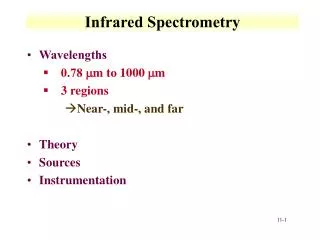
Potential Estimation of Minerals Content in Cow Milk Using Mid-Infrared Spectrometry. H. Soyeurt 1 , D. Bruwier 1 , N. Gengler 1,2 , J.-M. Romnee 3 , and P. Dardenne 3 1 Gembloux Agricultural University, Animal Science Unit, Belgium 2 National Fund for Scientific Research, Belgium

E N D
36th ICAR Session and Interbull MeetingNiagara Falls, 16-20 June 2008 Potential Estimation of Minerals Content in Cow Milk Using Mid-Infrared Spectrometry H. Soyeurt1, D. Bruwier1, N. Gengler1,2, J.-M. Romnee3, and P. Dardenne3 1 Gembloux Agricultural University, Animal Science Unit, Belgium 2 National Fund for Scientific Research, Belgium 3 Walloon Agricultural Research Centre, Quality Department, Belgium
Introduction • Interest for human and animal health: • Ca : osteoporosis, milk fever • Na : milk fever, alkalosis, indicator of mastitis? • Dairy products with high Ca content are commercialized to prevent osteoporosis (e.g., Belgium,…)
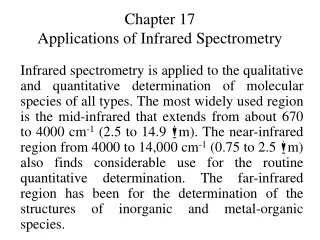
Introduction • Regular analysis • Inductively Coupled Plasma Atomic Emission Spectrometry: ICP-AES • Fast • Expensive • Previous studies on the measurement of milk components by Mid-Infrared (MIR) Spectrometry: • Fast and cheap • %fat, %protein, %fatty acids, %lactose, urea,…
General Objective • Estimate the contents of the major minerals in cow milk (Ca, Na, and P) by MIR spectrometry
Milk Samples • 1,609 milk samples : • March 2005 and May 2006 • 478 cows in 8 herds belonging to 6 dairy breeds: • dual purpose Belgian Blue, Holstein Friesian, Jersey, Montbeliarde, Normande, and non-Holstein Meuse-Rhine-Yssel type Red and White • 2 samples: • MilkoScan FT6000 during the Walloon milk recording • Conserved at -26°C
Calibration • Selection of samples : • Principal Components Approach (PCA) • 70 selected samples • 9 samples with bad conservation • 4 outliers • Reference analysis: • ICP-AES without mineralization
Calibration • Equations: • 57 samples • Partial Least Squares (PLS) regressions • Repeatability file: • Walloon part of Belgium • Luxembourg • Accuracy: Full cross-validation
Results SD = Standard deviation; SECV= Standard error of cross-validation; R²cv = Cross-validation coefficient of determination; RPD = the ratio of SD to SECV • If RPD > 2, good indicator • Good prediction of Ca and P (high contents)
Real MIR absorbance? Rcv = 0.90
Real MIR absorbance? Rcv = 0.88
Validation • Validation: • Internal validation: • cross-validation • External validation: • samples not used for the calibration procedure • 30 milk samples
Validation Calcium R² = 0.95
Validation Phosphorus R² = 0.84
Conclusion • Potential estimation of Ca and P directly on bovine milk • Prospects for the calibration: • Increasing the samples used for the calibration • Executing a larger external validation
Prospects • Genetic variability of minerals • Prevent osteoporosis • Feeding has a low influence on Ca content • Heritability (26,086 data): • Calcium: 0.42 • Phosphorus: 0.47 • Prevent milk fever? • Indicators of mastitis??
Thank you for your attention Acknowledgments FNRS: 2.4507.02F (2) F.4552.05 FRFC 2.4623.08 soyeurt.h@fsagx.ac.be