Download
1 / 94

E N D
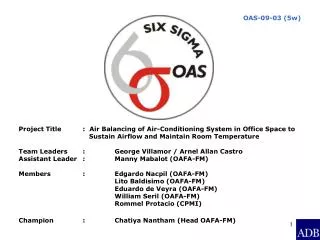
OAS-09-03 (5w) Project Title : Air Balancing of Air-Conditioning System in Office Space to Sustain Airflow and Maintain Room TemperatureTeam Leaders : George Villamor / Arnel Allan CastroAssistant Leader : Manny Mabalot (OAFA-FM)Members : Edgardo Nacpil (OAFA-FM) Lito Baldisimo (OAFA-FM) Eduardo de Veyra (OAFA-FM) William Seril (OAFA-FM) Rommel Protacio (CPMI)Champion :Chatiya Nantham (Head OAFA-FM)
Project Charter DEFINE Business Case: The central air-conditioning system of the building supplies conditioned air to offices. This provides comfort cooling to staff inside the building. Air conditioning system consumes about 44% of the total energy consumption of HQ. Main components of air conditioning system are the central chillers in the Plant Room, cooling towers, chilled and condenser water pumps, floor air handling units (AHU), fan-powered units (FPU), fan coil units (FCU) and outside air supply (OAS). This project will focus in improving the Air conditioning System efficiency through proper air balance in the office areas and is expected to further reduce the overall energy consumption and complaints in ADB.
Project Charter DEFINE Problem Statement: Even after improvements in air-conditioning system in a number of areas in ADB, complaints on uncomfortable room temperature have been received through BSR & BMS. Corresponding adjustments have been made that generate extra energy requirements due to inefficient operations of the air-conditioning system. These inefficiencies need to be resolved. Project Goal: To improve efficiency of air-conditioning system by regulating office temperature within control parameters of 23°C ±1°C through air balancing. Project Scope: The project will focus on maintaining temperature at 22°C to 24°C and airflow relative to set point temperature at a given office area of the entire 4th floor of the Office Tower Block (Segment A). • BSR – Building Service Request • BMS – Building Management System
Overview DEFINE Completed Six Sigma Projects in relation with Improvement in Air-conditioning System ● Optimization of Central Air-conditioning Chiller System (2006) Project goal: To improve and maintain chiller plant operating efficiency by less than 0.75kw/ton to realize energy saving without sacrificing the quality of air conditioning services. ● Improving Air-conditioning Services in Offices (2007) Project goal: To reduce the number of overall complaints by 30% from 1,590 to 1,113 annually through the reduction of legitimate complaints to about 6 complaints per month from the present number of 47. ● Improve Air Handling Unit Performance (2008) Project goal: To improve the current operating performance of the old air handling unit to at least 80% of the design capacity. ● Improvement of Fan-Powered Unit air temperature distribution in Offices (2008) Project goal: To maintain ADB standard setting of 23°C±1°C thereby reducing complaints of cold and hot temperature by 90%.
High Level Process Map AIR HANDLING UNITS CHILLER PLANT FAN- POWERED UNITS DEFINE COLD AIR DISTRIBUTION TO OFFICE AREAS Chiller Plant supplies chilled water to 72 Air Handling Units (AHU), 10 Outside Air Supply (OAS) and a no. of Fan Coil Unit (FCU) in the entire ADB building. Air Handling units receive chilled water thru cooling coil and processes cold air to supply the main duct system which are in loop per floor level at Office Tower Block. Fan-powered units distribute cold air to the office areas. It regulates the temperature by mixing primary air and return air thru the control of respective thermostat. These are the outlets or diffusers where air is discharged to office areas where air balancing is required to ensure equal distribution of cold air.
Bar Chart Aircon Complaints Complaints (Oct 2008 – Jan 2009) DEFINE (From October 2008 – January 2009)
DEFINE Pareto Chart Aircon Complaints per Zone
DEFINE Floor Zoning Rooms plotted w/ Complaints ZONE 2 [19] 4265, 4264, 4244, 4228, 4241, 4240 ZONE 1 [6] 4160, 4142, 4130, 4168, 4133 ZONE 3 [18] 4329, 4336, 4306, 4314, 4316, 4304, 4324, 4333 ZONE 7 [17] 4726, 4728, 4706, 4727, 4712, 4716, 4720, 4724 ZONE 4 [19] 4463, 4416, 4401, 4446, 4405, 4440, 4472 ZONE 5 [3] 4522, 4521, 4512 ZONE 6 [13] 4671, 4664, 4663, 4662, 4645
Airflow Calculation DEFINE
SIPOC Diagram DEFINE INPUT SUPPLIER PROCESS OUTPUT CUSTOMER ADB AC Technician BMS Operator Instrument Technician CPMI Engineering Staff ADB Engineering staff Balancing of airflow distribution Through FPU AHU Thermostat Cooling comfort temp. (23°C±1°C) Compliance to ASHRAE Std. Regulate the airflow base on specific area ADB
CTQ Matrix DEFINE Operating condition of air-conditioning system at office areas. Output Unit Output Characteristic ( Big Y ) Balance Airflow (lps) C T Q Operations definition of process to be measured Maintain proper airflow with respect to standard temperature set point. (23°C±1°C) Project Y ( Little Y ) Measure How process will be measured: Balancing/adjustment of airflow based on specified area. (lps or liters/sec) Airflow per room area (lps/sq. m.). LSL: none Specification Limits North Exposure South Exposure East Exposure West Exposure Interior areas USL: 10.7 USL: 12.0 USL: 9.5 USL: 11.8 USL: 4.1 Target Average calculated airflow. (USL is calculated + 10%) Below calculated and above USL. Defect No. of defect opportunities per unit. One (1) opportunity for a defect per operation.
Milestone/Timeline DEFINE D M A I C • Define 01 Jan. 09 to 25 Feb. 09 • Measure26 Feb. 09 to 31 Mar. 09 • Analyze 23 Mar. 09 to 29 Apr. 09 • Improve 30 Apr. 09 to 27 May 09 • Control 28 May 09 to 30 Jun. 09
Airflow Measurement Taken 23 Feb – 06 Mar 09 MEASURE Collected Data: • Rooms floor area (sq. m.) - Total of 243 rooms at Level 4 of Tower block • Number of occupants per room • Supply airflow per room (lps) Collected data were subjected to Normality Test, Process capability, and determine current sigma level.
Equipment Operating Parameters MEASURE
Air Handling Unit, Main Duct Loop, and Fan Power Unit Layout MEASURE Main Duct Loop AHU ROOM CORE-5 AHU ROOM CORE-6 AHU ROOM CORE-4 E D S A A D B A V E N U E AHU ROOM CORE-2 AHU ROOM CORE-3 AHU ROOM CORE-1 Main Duct Loop
Heat Load Components in Room MEASURE Sun Fan-Powered Unit Return Air Solar Radiation Air Handling Unit Supply Air Light Occupant Heat transmission Pre-cooled Outside Air Equipment Chilled water Piping Pump Chiller Plant Room
MEASURE Sun Path at ADB
Different Sun Path per Quarter MEASURE
Room Airflow Measurements (North) MEASURE Computed and Measured Airflow for North Exposure Areas per room area: Total Rooms: 27 units Total No. of Occupants: 78 staff Ave. Computed Airflow per sq. m. 10.7 lps/m²
Room Airflow Measurements (South) MEASURE Computed and Measured Airflow for South Exposure Areas per room area: Total Rooms: 33 units Total No. of Occupants: 33 staff Ave. Computed Airflow per sq. m. 12 lps/m²
Room Airflow Measurements (East) MEASURE Computed and Measured Airflow for East Exposure Areas per room area: Total Rooms: 18 units Total No. of Occupants: 18 staff Ave. Computed Airflow per sq. m. 9.5 lps/m²
Room Airflow Measurements (West) MEASURE Computed and Measured Airflow for West Exposure Areas per room area: Total Rooms: 18 units Total No. of Occupants: 25 staff Ave. Computed Airflow per sq. m. 11.8 lps/m²
Room Airflow Measurements (Interior) MEASURE Computed and Measured Airflow for Interior Areas per room area:
Room Airflow Measurements (Interior) MEASURE Computed and Measured Airflow for Interior Areas per room area: Total Rooms: 124 units Total No. of Occupants: 426 staff Ave. Computed Airflow per sq. m. 4.1 lps/m²
MEASURE Is Data Normal? (North Exposure) For Normal Data: P-Value > 0.05 Mean is approximately equal to median For this normality test: P-value of 0.071 is > 0.05 Mean (10.37) is approximately equal to median (9.40) Data Points are within the confidence interval The normality test confirms that the data is Normal
MEASURE Is Data Normal? (South Exposure) For Normal Data: P-Value > 0.05 Mean is approximately equal to median For this normality test: P-value of 0.068 is > 0.05 Mean (12.485) is approximately equal to median (11.90) Data Points are within the confidence interval The normality test confirms that the data is Normal
MEASURE Is Data Normal? (East Exposure) For Normal Data: P-Value > 0.05 Mean is approximately equal to median For this normality test: P-value of 0.102 is > 0.05 Mean (13.539) is approximately equal to median (15.30) Data Points are within the confidence interval The normality test confirms that the data is Normal
MEASURE Is Data Normal? (West Exposure) For Normal Data: P-Value > 0.05 Mean is approximately equal to median For this normality test: P-value of 0.923 is > 0.05 Mean (13.489) is approximately equal to median (13.05) Data Points are within the confidence interval The normality test confirms that the data is Normal
MEASURE Is Data Normal? (Interior Rooms) For Normal Data: P-Value > 0.05 Mean is approximately equal to median For this normality test: P-value of 0.296 is > 0.05 Mean (4.016) is approximately equal to median (4.10) Data Points are within the confidence interval The normality test confirms that the data is Normal
ANALYZE Overview & Importance of Air Balancing • Air balancing is a methodical regulation of air flow rates through the use of workable and industry accepted procedures to achieve desired flow quantities in each air outlets/diffusers. Having a properly balanced building is the key to a comfortable work environment. • Air balancing is one of the processes involved in the commissioning of building facilities whereby verifying, achieving and documenting the performance is done through out the life of a building from pre-design phase up to occupancy and operation phase. • For a central air-conditioning system to properly operate and give the desired zone comfort air balancing works is required. • Using the Six Sigma methodology, variability of measured air flow for each outlet can be analyzed to identify and subsequently improved air distribution system such fixing duct leakage and adjusting air dampers to give required flow rates.
Cause and Effect Diagram of Variation in Room Temperature at Office Areas ANALYZE Operation Machine Environment Air handling unit Unbalance Room Airflow Fan-powered unit C C C Dampers and Controls AHU operation and heat exchange Weather C C N Piping and Ducting system Exposure FPU mixing box operation C N C Chillers Chiller chilled water supply temperature C C Variation in Room Temperature at Office Areas C Data Monitoring and Analysis Accuracy and Calibration C BMS Operator C Technician C C Preventive Maintenance Sensors C C Occupant BMS programming C Personnel Best Practices Controls - Control C - Noise N
Cause and Effect Diagram of Unbalance Room Airflow ANALYZE Operation Room Alterations C Affected Fan-powered unit C Poor duct condition N Dirty filter Modified heat load Wrong Speed selector setting Volume Dampers C Wrong Thermostat setting Leakage Wrong FPU capacity C C C Leaking connection No provision Stuck up blade C Troffer Diffuser C Affected duct size C Control C C C Localized air diffuser due to relocated lighting fixture (troffer) Leak Short circuiting C BMS Loss communication Improper mounting to lighting fixture air slot Unstable FPU operation C Malfunction N UnbalanceRoom Airflow C C C C C Unreported abnormalities C No relevant Testing, Adjusting, and Balancing / O&M training Monitor data not correctly analyze C Night shift duty C Undone Preventive Maintenance C No best practice being followed C Personnel Methods - Control C - Noise N
Chart of Computed Airflow vs Measured Airflow (North Exposure) ANALYZE - Computed Airflow - Measured Airflow
Chart of Computed Airflow vs Measured Airflow (South Exposure) ANALYZE - Computed Airflow - Measured Airflow
Chart of Computed Airflow vs Measured Airflow (East Exposure) ANALYZE - Computed Airflow - Measured Airflow
Chart of Computed Airflow vs Measured Airflow (West Exposure) ANALYZE - Computed Airflow - Measured Airflow
Chart of Computed Airflow vs Measured Airflow (Interior Rooms 1 of 2) ANALYZE
Chart of Computed Airflow vs Measured Airflow (Interior Rooms 2 of 2) ANALYZE
ANALYZE Findings Based on measured airflow data gathered, percent of unbalance area per exposure are concluded: North exposure – 92.5% South exposure – 78.7% East exposure – 83.3% West exposure – 66.6% Interior rooms – 82.2%
ANALYZE Findings Some Fan-powered unit does not deliver the right amount of supply air due to duct leak, fit-up and connections are not proper, or Fan-powered unit capacity is undersize, that causes waste cold air just flow above ceiling and unwanted areas.
ANALYZE Findings Rooms that are affected by unbalance airflow:
IMPROVE Proposed Solution Operation Room Alterations • Visually check all ducts upstream of FPU for leak, apply sealant/repair prior to re-measuring. • Check troffer diffuser connection from plenum to lighting fixture mounting, secure all loose fittings. • All balancing will only be adjusted thru volume dampers, be sure that it is locking. • Submittal of existing and proposed drawings for approval. • Check that no two Fan-powered unit supplying one room. Balancing of Airflow in Office Areas Personnel Methods • Training and supervision • Established best practices in air balancing.
IMPROVE Air Balancing Procedure Air Balancing Procedures: List and identify size, type and manufacturer of all diffusers, grilles, registers and all tested equipment. Use equipment manufacturer’s ratings to make any required calculations. Identify each grille, diffuser and register with a number that is referenced on an accompanying sketch. Test and adjust system for design percentage of outside air. Record fan powered unit capacity (horsepower). Determine total supply in lps using balometer. Test and adjust blower RPM as necessary to achieve design lps. If the system is constant volume, adjust all zones to proper design lps, supply. Test and adjust each diffuser, register and grille to within plus or minus 10% of design requirements. Care should be taken to minimize drafts whenever possible. Test and record re-circulated air flow rate (lps). Test and record system static pressures, suction and discharge. Temporarily set water flows and temperatures to design conditions for temperature tests. Test and record entering air temperatures. (dry bulb heating and cooling) Test and record entering air temperatures. (wet bulb cooling) Test and record leaving air temperatures. (dry bulb heating and cooling) Test and record leaving air temperatures. (wet bulb cooling) List test data for all diffusers, grilles and registers, including design lps and test resultant lps after adjustment. Test and record required information.
IMPROVE Failure Mode and Effect Analysis (FMEA)