Download
1 / 58
580 likes | 681 Views
Analysis of the Municipal Water Supply Network in the Lower Rio Grande Valley. Presentation Prepared for the Region M Water Planning Group November 19, 2003 McAllen, Texas. Municipal Water Supply Network. “MSN” ( municipal supply network ) will be used in this presentation to refer to

E N D
Analysis of the Municipal Water Supply Network in the Lower Rio Grande Valley Presentation Prepared for the Region M Water Planning Group November 19, 2003 McAllen, Texas
Municipal Water Supply Network “MSN” (municipal supply network) will be used in this presentation to refer to • the portions of the irrigation district distribution networks which also carry municipal water • Defined by the locations of existing control structures (gates, valves, etc.) which can isolate the MSN
Guy Fipps, PhD, P.E. Professor and Extension Agricultural Engineer Biological and Agricultural Engineering Dept., Texas A&M University, College Station (since 1988) Director of the Irrigation Technology Center, a newly formed center under the Texas Water Resources Institute
Regional Water Planning Experience in the Lower Rio Grande Valley Conducted the analysis of water savings potential in irrigated agriculture for the: • Lower Rio Grande Integrated Water Resources Plan Project – Phase II (final report: December 22, 1998) • Region M Water Plan (final report: December 22, 2000) These reports are posted at http://idea.tamu.edu and the full text of our reports was included in the appendixes of each final project reports
Irrigation Technology Center • Incorporating some existing programs into the ITC, including our Irrigation District Engineering and Assistance Program • For more information: http://itc.tamu.edu
Irrigation District Engineering and Assistance Program Engineering analysis, technical assistance, applied research, workshops and short courses (see handout for more information) IDEA Team Wesalco Eric Leigh – Extension Associate Martin Barroso – Ag Technician Noemi Perez – Ag Technician Collage Station Dave Flahive – System Analyst/Programmer Dr. Yanbo Huang – Extension Associate (1/2 time)
Irrigation District Engineering and Assistance Program Funding • About 2/3 of current funding is from the federal legislative initiative: “Irrigation Conservation in the Rio Grande Basin” (for more information, see http://riogrande.tamu.edu) • About 1/3 of funding is from grants, contracts, and fees for services and products
Irrigation District Engineering and Assistance Program Activities Related to the MSN Analysis • This year, we have provided assistance to 18 irrigation districts in Region M on seepage loss testing of canals, and analysis of the need for and water savings of rehabilitation projects. • Released updated GIS-based maps of irrigation districts
Maps • New, 3-map series of irrigation districts in the LRGV • maps of all districts in the Rio Grande Basin • Complimentary copy of our “location map” • See handouts for additional map information
Municipal Supply Network Analysis • Over the last year, received numerous requests for assistance on determining “push water” requirements • Included the MSN analysis in my work plan for the second year of the Rio Grande Initiative which runs: May 15, 2003 – May 14, 2004
Municipal Supply Network Analysis Are our interests in this analysis the same?
Municipal Supply Network Analysis Concerns • Definition of “push water” • Data is not easily obtainable • Planned and unanticipated use of the data • Degree of accuracy needed (accuracy should be related to the planned use of the data)
Municipal Supply Network Analysis Concerns(continued) • Complexity of task and labor/effort necessary to produce accurate results • Details on types of data and analyses needed • Limited funds from Rio Grande Initiative available for this effort
Municipal Supply Network Analysis Procedures Used
Procedures • Identification/verification of districts with municipal water deliveries • Met with districts to: - define MSN by locating control structures - obtain sizes, dimensions and capacities of MSN components
Procedures Out of the 14 districts 1 district - all needed information was readily available 2 districts - much of the needed information was readily available Our GIS database has - top width of most canals, - but not the water depths and actual water span widths under normal operational conditions (needed for MSN calculations)
Procedures • With district staff, took field measurements of MSN • Determined the surface areas of reservoirs and resacas using aerial photographs • Determined segment lengths from GIS
Procedures • Computed initiate MSN estimates • Summarized data and produced tables and maps for districts to review • Dropped off materials at district offices and followed-up to collect comments/corrections
Procedures • Took follow-up field measurements and other efforts to develop complete data sets • Completed final MSN estimates under normal operational conditions: - static volume - evaporation - seepage losses • Collected available info on the types, sizes and operational criteria of municipal takeout structures • Define additional analysis needed (in progress)
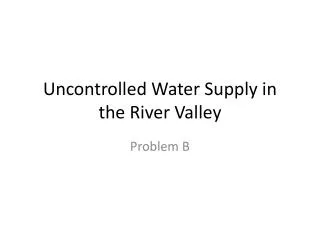
Municipal Supply Network Produced two maps illustrating the extent of the MSN Network
Notes on MSN Maps • Locations of the 39 municipal treatment plants were not confirmed (based on data provided by the Rio Grande Watermaster office) • Did not map the municipal supply systems that carries water from the district take-out point to plant
Municipal Supply Network Static Volume of the MSN Network
Municipal Supply Network Static Volume of the MSN Network The volume of water needed to fill the system to normal operational levels used for agricultural water delivery
Canal Shapes and Capacities • few districts had data readily available on - canal shapes and related dimensions (such as bottom width - for trapezoidal) - surface area of resacas • Some did not have reservoir surface area at normal operating depths
Canal Shapes and Capacities • For unknowned canal shapes or canals with incomplete data, assumed: - parabolic shape (low volume estimate) - rectangular shape (high volume estimate)
Municipal Supply Network Static Volume of the MSN Network 15,000 – 17,300 ac-ft
MSN Network Characteristics(see table 2 for details) These are the preliminary estimates of static volume of water (ac-ft) needed to charge the MSN for normal agricultural water deliveries (excludes siphons, culverts)
Municipal Supply Network Evaporative and Seepage Losses of the MSN
Municipal Supply Network Evaporative and Seepage Losses of the MSN (at normal operational levels for agricultural water delivery)
Evaporative Loss Calculations • Peak evaporation rate: canals, resacas 0.8 x pan evaporation x surface area (avg. peak evaporation rate is 0.25 in/day in July) reservoirs lake evaporation x surface area (avg peak evaporation is ~0.33 in/day in the LRGV)
Peak Evaporative Losses(preliminary data) These are estimates of the total peak evaporation (ac-ft/day) of the MSN at normal operational levels
Peak Evaporation Losses Excluding Delta Lake (58 ac-ft/day)
Seepage Loss • Most districts have water loss charges based on percentage - ranging 15 - 30% • 1 district has a higher charge for municipal deliveries when there is no ag water • 2 districts use rates based on the gallons delivered For calculating seepage losses - we need a rate such as gal/ft2/day (most common loss rate used)
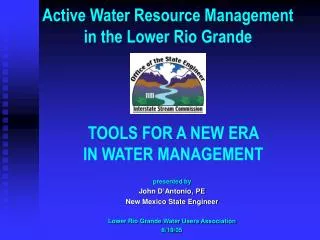
Seepage Loss Tests We have conducted about 50 ponding tests since 1988 to measure seepage and total losses from canals
Seepage Losses These are the locations of our tests
Seepage Losses However, only a few have been on the MSN
Seepage Losses • I do not know what the seepage loss rates are of the MSN • Extrapolating from ponding test results, I expect that losses will be the same range of seepage losses as the majority of tested canals
Leaks for pipelines • Tested only 1 pipeline • Loss rate depends on type of materials, type of joint materials (if used), and how full pipe flows • I expect that total losses in the 26 miles of pipeline is 0.25 - 18.0 ac-ft/day, but more work is needed to confirm this estimate
Seepage Losses Preliminary Analysis, excluding pipelines 117 ac-ft/day (low) 808 ac-ft/day (high) 1171 ac–ft/day (high with leaks)
No Agricultural Water • Operational levels for some districts is lower when only supplying municipal water • This would reduce both the static volume and seepage losses - seepage loss rates, in many cases, are lower at shallower depths - the wetted perimeter (or the effective area) decreasing very rapidly with lower depths
No Agricultural Water Out of the 14 districts, • 4 have the data on operational levels needed for just municipal water • 1 district temporarily raises canal levels during municipal diversions Remaining data would need to be collected from water utilities