Download
1 / 10
100 likes | 187 Views
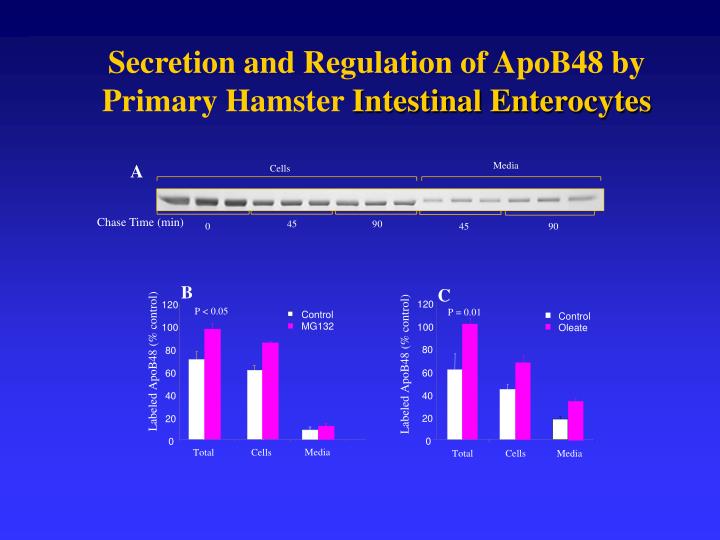
120. 120. 100. 100. 80. 80. 60. 60. 40. 40. 20. 20. 0. 0. Secretion and Regulation of ApoB48 by Primary Hamster Intestinal Enterocytes. Media. A. Cells. Chase Time (min). 45. 90. 0. 45. 90. B. C. P < 0.05. P = 0.01. Control. Control. MG132. Oleate.

E N D
120 120 100 100 80 80 60 60 40 40 20 20 0 0 Secretion and Regulation of ApoB48 by Primary Hamster Intestinal Enterocytes Media A Cells Chase Time (min) 45 90 0 45 90 B C P < 0.05 P = 0.01 Control Control MG132 Oleate Labeled ApoB48 (% control) Labeled ApoB48 (% control) Media Total Cells Total Cells Media
100 90 80 70 60 50 40 30 20 10 0 Ex vivo evidence for oversecretion of intestinal apoB48 & Enhanced intracellular apoB48 stability in fructose-fed hamster enterocytes Media Cells D Fructose-Fed Chow-Fed Chase Time (Min) 0 45 90 45 90 E F Total apoB 48 Secreted apoB 48 100 90 80 Labeled ApoB 48( % of 0 Time) 70 p= 0.003 Labeled ApoB 48( % of 0 Time) p= 0.001 60 Chow-Fed 50 Fructose-Fed 40 30 20 10 0 0 20 40 60 80 0 20 40 60 80 100 100 Chase Time (Min) Chase Time (Min)
In Vivo Production of TG & Intestinal ApoB48 in the Fasting State
In Vivo Production of TG & Intestinal ApoB48 in the Postprandial State
180 160 140 120 120 100 100 80 80 60 60 40 40 20 20 0 0 Ex Vivo Evidence for Intestinal Overproduction of Lipoprotein Lipids and Increase MTP mass/activity p=0.04 p=0.0013 Labeled Cholesterol (% of Control) A C B p=0.003 800 Labeled Triglyceride (% of Control) Labeled Cholesteryl Ester (% of Control) p= 0.002 250 p=0.001 700 Chow-Fed 200 600 Fructose-Fed 500 p=0.0018 150 400 300 100 200 50 100 0 0 Media Media Media Cellular Cellular Cellular E Fructose-fed Chow-fed Chow-Fed Fructose-Fed D p=0.006 160 ApoB 48 Secretion (% of control) 140 120 100 MTP Protein Mass (% of Control) 80 60 40 20 0 0.5 1 1.5 2 2.5 3 3.5 0 MTP inhibitor (M) Chow-Fed Fructose-Fed
80 70 60 50 40 120 30 20 100 10 80 0 60 20 Density/Size Distribution of Intestinal Lipoproteins Evidence for Increased Number & Size A B Chow-fed p= 0.06 80 p<0.026 Fructose-Fed 70 60 50 p<0.024 % of Total Labeled APoB48 40 % of Total Labeled ApoB48 p<0.05 30 20 p<0.03 10 0 Large CM Small CM VLDL LDL HDL Particles< 1.006 Particles > 1.006 140 Fasting Postprandial C D p<0.01 120 p<0.0007 P=0.0001 P=0.008 100 80 Labeled ApoB48 (% of Fructose-fed) Labeled ApoB48 (% of Fructose-fed) 60 40 40 20 0 0 Total apoB48 CM apoB48 Total-apoB48 CM apoB48
110 100 90 110 80 100 70 90 60 80 50 70 40 60 30 50 20 40 10 30 0 20 10 0 350 300 250 200 150 100 50 0 Increased De Novo Lipogenesis in FF Enterocytes Evidence that ApoB48 Secretion is Linked to the Rate of De Novo Lipogenesis A p= 0.002 Fatty Acid Synthesis Labeled Fatty Acid (% as control) Labeled Lipid (% as control) Sensitivity of TG & FA Secretion to Cerulenin Cholesterol Fatty Acid Triglyceride 0 2 4 6 8 10 12 14 16 Chow-fed Fructose-fed Cerulenin g/ml C Labeled Secreted ApoB-48 (% as control) Sensitivity of ApoB48 Secretion to Cerulenin 0 2 4 6 8 10 12 14 16 Cerulenin g/ml
1000 800 600 400 200 0 Acute Fructose Feeding or Exposure Does NOT Affect Intestinal ApoB48 Secretion Two-day Fructose Feeding In Vitro Incubation of Enterocytes with Fructose 120 120 100 100 80 80 Labeled ApoB-48 (% of control) Labeled ApoB-48 (% of control) 60 60 40 40 20 20 0 0 Chow-fed Fructose-fed (2 days) Control Fructose (3mM ) 450 P < 0.01 P < 0.0001 400 350 [14C] Fructose Incorporation into TG & Cholesterol 300 Labeled cholesterol Labeled Triglyceride 250 200 150 100 50 0 hepatocytes enterocytes hepatocytes enterocytes
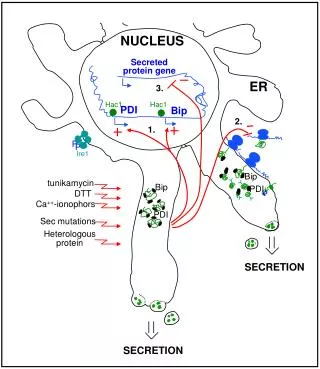
p85 b b IR a a Mechanisms of Intestinal Lipoprotein Overproduction in Insulin Resistant/ Hyperinsulinemic States TG dietary monoglyceride Apical Surface Intestinal Enterocyte FA De Novo (FA) FABP TG Glucose + FABP-FA FA ER FAS & ACC TG TG SREBP1c MTP PL Golgi PKB (Akt) TG CE PI3-K SOS ApoB48 IRS Proteasome p110 Grb-2 Degradation SHP-2 NCK Basolateral Surface PTK PTK ApoB48 Lipoprotein Particles Insulin (??)
Acknowledgements Collaborators:Gary Lewis- TorontoAndre Carpentier- SherbrookeSven Olof Olofsson - Sweden Janet Sparks - Rochester, NY Raphael Cheung – Windsor Michel Tremblay – Montreal Denny Trinh - Toronto Laboratory Group: Changiz Taghibiglou Mehran Haidari Steven Van Iderstine Wei QuiTaryne Chong Farhana Mahboob Biao ChenLeyla MangalogluLouisa Pontrelli Fariborz Rashid Rita Kohen Debbie Rudy Funding: Heart & Stroke Foundation of Ontario Canadian Institutes of Health Research NSERC Hospital for Sick Children Merck-Frosst pfizer GlaxoSmithKline BBDC, University of Toronto