Download
1 / 70
710 likes | 927 Views
EMC Consortium University Missouri Rolla. UMR EMC Consortium - Structure. UMR EMC Consortium. Zuken. Intel. Sony. IBM. Freescale. LG-Electronics. Hitachi. Apple, Altera. GTL. NCR. TI. NEC. HuaWei. CISCO. Focused research areas Methodology results are shared. 5 faculty

E N D
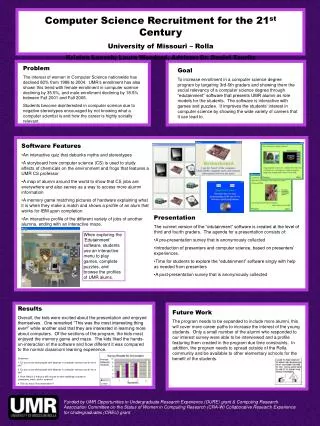
EMC Consortium University Missouri Rolla
UMR EMC Consortium - Structure UMR EMC Consortium Zuken Intel Sony IBM Freescale LG-Electronics Hitachi Apple, Altera GTL NCR TI NEC HuaWei CISCO • Focused research areas • Methodology results are shared • 5 faculty • 20+ grad. students
UMR EMC Consortium - Research • Classical EMC (Shielding, gaskets, etc.) • EMC Expert system • EMC test methods • IC related EMC (SSN, Current paths, Immunity) • Power Distribution - PCB level • Power Distribution - IC level • Signal Integrity: Link path analysis • ESD • Application of numerical methods • Design of numerical methods • Design of test instruments
Immunity scanning results, identifying sensitive traces and comparing two “identical” ICs. Performed for ESD like pulses coupling into a PC motherboard. Color indicates sensitivity.
Jitter Jianmin Zhang, David J. Pommerenke
References • Agilent Technologies, numerous application notes, see http://www.home.agilent.com/agilent/facet.jspx?to=80030.k.1&co=153297.i.1&cc=US&lc=eng&sm=g&k=jitter • LeCroy, Tektronix, Bertscope • J. Hancock, “Jitter—understanding it, measuring it, eliminating it Part 1-3”, From 2004 High Frequency Electronics • A. Kuo etc. “Jitter models and measurement methods for high-speed serial interconnects” • S. Tabatabaei etc, “Jitter generation and measurement for test of multi-GBPS serial IO” • Altera Web Site, Le Croy Web site
Outline • Introduction • Eye diagram • What is jitter? • Phase noise, spectrum vs. jitter • Why is jitter important? • What causes jitter? • Jitter fundamentals • Jitter components • Jitter measurement views • Jitter measurement and analysis • Real-time jitter analysis • Techniques to isolate jitter components • Questions and answers
Eye pattern • A very effective method of measuring time distortion thru a data transmission system is based on the eye pattern, displayed on an oscilloscope. • The eye pattern is simply the superposition - over one unit interval – of all the Zero–to–One and One–to-Zero transitions, each preceded and followed by various combinations of One and Zero, and also constant One and Zero levels. • The data sequence can be generated by a pseudo-random sequence generator (PRSG), which is a digital shift register with feedback connected to produce a max length sequence.
Timing skew Jitter Ideal sampling position Voltage Noise and required comparator input Voltage offset Ideal reference point
Logic-Based Measurement • E.g., BERT • Bit errors caused by jitter • Data measured at sampling point has BER • Sweeping the sampling point creates bathtub curve 0 1 BER Sampling Point
BER BER Time Time Eye diagram Bit error curve as a function of sampling moment How long would it take if we like to get down to 10e-12 Bit Error Rate?
What Is Jitter? Jitter: The deviation of the significant instances of a signal from their ideal location in time. Or simply, Jitter is how early or late a signal transition is with reference to when it should transition. The significant instances are the transition (crossover) points in a digital signal. Jitter is closely related to phase modulation. P is a wave shape function, e.g., sin or square wave.
What Is Jitter? Phase noise can be analyzed from many points of view: It can be understood as - phase variation (phase noise) - timing variation (time shift of edges) [seconds] mostly used, intuitive system description, independent of data rate. - fractions of the period (unit less) [%] Good for directly seeing how many percent of the eye is open
Why Jitter Is Important? • Jitter causes transmission errors or in another wording: Jitter limits the transmission speed. • Satisfy jitter budget BER (bit error rate) target • Identify jitter components diminish/decrease deleterious effects on circuit performance from jitter • Jitter limits the ability of A/D converters! Note: Bit errors can also be caused by voltage noise: If the momentary noise voltage exceeds the noise margin, a wrong value can be sampled even if the sampling takes place at the correct moment in time.
Jitter applications Signal jitter: Timing of a signal (topic of this presentation) Jitter transfer: How strong, as a function of the jitter frequency, a jitter at an input is transmitted to an output in e.g., by a clock recovery circuit Jitter tolerance: How much jitter, as a function of the jitter frequency, can be tolerated by a system
Signal jitter: Why Jitter Is Used? • Jitter is not a main system property, but Bit Error Rate (BER) is. • Why not measuring BER directly? • BER measurement might take hours or days. • BER gives little information about the mechanism that cause errors, but jitter does. Is this error caused by jitter?
Signal Ideal clock 1101001 Degraded Noisy clock 1101101 Bit errors can also be caused by voltage noise: If the momentary noise voltage exceeds the noise margin, a wrong value can be sampled even if the sampling takes place at the correct moment in time.
Main types of Jitter Data-Correlated Data-Uncorrelated Total Jitter (TJ) Random Jitter (RJ) Deterministic Jitter (DJ) Data Dependent Jitter (DDJ) Periodic Jitter PJ Inter-symbol Interference (ISI) Duty Cycle Distortion (DCD) Note shown: Sub rate Jitter (SRJ)
Types of Jitter Jitter can be random or deterministic. In most cases, both types occur. PJ: Periodic Jitter (deterministic). Is a periodic variation in the phase. Causes: External coupling into the circuit, power supply noise, PLL comparator frequency feed-through RJ: Random Jitter Random changes in the phase. It is often assumed to be of Gaussian distribution. Causes: Thermal Noise, Shot Noise Let’s look at some examples
Types of Jitter Jitter can be random or deterministic. In most cases, both types occur. DCD: Duty Cycle Distortion (deterministic). Is the difference in the mean pulse width between positive and negative pulses in a clock. Causes: Amplitude offset, turn-on delay, saturation. ISI: Inter-Symbol Interference (deterministic) Previous signals have not rang down, before new data arrives. Causes: Impulse response is longer than a data bit.
Phase Modulation - Jitter: The same Ideal clock Phase modulated clock Sine Modulation term f=1 GHz
How does the Spectra look like? Square wave Phase modulated
How Does the Eye-Diagram Look Like? How about using a square wave as phase modulator?
How Does the Eye-Diagram Look Like? How about using a Gaussian noise as phase modulator?
Effect of data length: Few hundred bits: Billion bits: What is the consequence for the eye opening, expressed in ps?
TJ Estimation TJp-p = N x σrms + DJ If the trigger point is 7 sigma away from the mean event, only 1 in 10e12 crossings will occur even beyond the trigger point.
Time interval error and jitter trend (integral of time interval error) What does it mean if the jitter trend is continuously increasing over time?
Histogram in A Square Wave Time interval error and jitter trend (integral of time interval error)
Channel Characteristics Loss, reflections, cross talk, added white noise, time variations S21 frequency Power Frequency
Pulse response Out In Tx symbol …000010000000…
LTI property: Superposition of symbols Response to pattern 100111 Out In Tx symbol …000010011100…
What Can You Tell? Which jitter components do you see? What might cause them?
Sequence of Jitter analysis Step 1: Measure - Real time scope - Equivalent time scope - Spectrum Analyzer Step 2: Separate jitter components - Average - Change data pattern (PRBS to 01010101) - TIE - etc.
Instruments to measure jitter Real time oscilloscope: Usually 8 bit, absolute clock, clock re-generation possible, bandwidth up to 20 GHz Sampling oscilloscope: 11-14 bit, relative to clock, bandwidth up to 1000 GHz Spectrum Analyzer: No time resolution (“real time spectrum analyzers” are an exception), very good dynamic range. Bandwidth up to 1000 GHz.
Real Time Jitter Analysis • Timing Measurements: • Data: Time Interval Error (TIE), also called phase jitter. • Clock: Period, Cycle-to-cycle. • Views: • Eye diagrams (repetitive volts vs. time) • Trend (time error vs. time) • Histograms (hits vs. time error) • Spectrum (time error vs. frequency) • Phase noise • Bathtub curves (BER vs. eye opening)