Download
1 / 37
370 likes | 614 Views
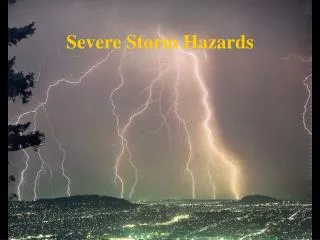
Severe Winter Storm Hits Puget Sound Creating Major Air Quality Event. Presented At EPA Air Quality Conference Orlando FL Feb 2007 . What we will do today . Overview of PSCAA Discuss our Wood Smoke Curtailment program Review the Air Quality Impacts from a Dec 2006 windstorm

E N D
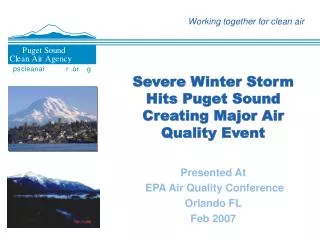
Severe Winter Storm Hits Puget SoundCreating Major Air Quality Event Presented At EPA Air Quality Conference Orlando FL Feb 2007
What we will do today • Overview of PSCAA • Discuss our Wood Smoke Curtailment program • Review the Air Quality Impacts from a Dec 2006 windstorm • Show preliminary findings on new ventilation forecasts
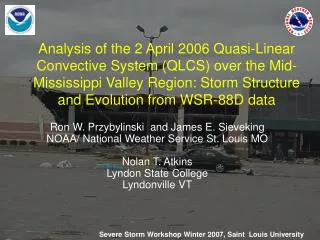
The Event • In mid December 2006 a strong pacific storm hit the Pacific Northwest. • Hurricane force winds, heavy precipitation caused damage to most parts of western Washington • Downed trees created widespread power outages leaving more than 750,000 residents without power or heat. • Following the storm’s passed synoptic conditions stabilized rapidly providing the mechanism for trapping pollution. • Many residents changed their normal practices, compelled to heat their homes with varied wood burning sources.
The Event • Air Quality conditions rapidly declined into unprecedented levels of unhealthy air impacting several a million Puget Sound residents. • Air Quality control decisions faced in this event • Communication challenges in shifting focus towards outdoor burning concerns • Return on investments • New questions raised regarding long term solutions in replacing fireplaces and uncertified devices
Wind Storm Aftermath- Dec 2006 No Starbucks Send help!
Puget Sound Clean Air Agency • Local government agency serving: • King • Pierce • Snohomish • Kitsap • Services include: • Enforcement • Permitting • Monitoring & Forecasting • Data • Air Quality Planning • Outreach
Agency Products • http://www.pscleanair.org/airq/aqi.aspx • http://trendgraphing.pscleanair.org/ • http://www.pscleanair.org/airq/visibility/default.aspx
Not just a weather forecast!!! • Human factors are strong modifiers of anticipated air quality for a particular suite of model guidance. • Post windstorm • Products • Daily Air Quality predictions • Based on EPA’s AQI • “Representative of “Neighborhood Scale” • Heavy reliance on a suite of “valued added” mesoscale decision aids. • Adapted by Atmospheric Sciences at U of Washington • Feedback from users • “Rapid response to problems
Our Wood Smoke Curtailment Program • Winter Program Based on : • Forecast weather pattern • Pollution levels • Washington State RCW establishes criteria. Key factors: • PM 2.5 monitoring levels • Profiler observations • Time duration of stagnant pattern • NWS forecast discussion • Mesoscale forecast guidance
Wood Smoke Curtailment- 2 Stage program • Meteorological Guidelines • NWS Air Stagnation Advisory • Inversion and light winds • Expected to last 72Hours or longer • Air Quality Criteria • Based on PM 2.5µgm3 • 24 hour running average is 35gm3 or higher • Stage one Burn Ban • 24 hour running average is 60µgm3 or higher • Stage two Burn Ban
Lessons Learned • Many people have wood burning devices that they do not routinely use • The post storm meteorology did not support the type of air quality level observed given normal public behavior • Our Agency chose to deviate from Burn Ban protocols until power was restored. • Need to rapidly communicate concerns regarding outdoor burning
Lessons Learned • Monitoring Network Infrastructure was rapidly restored and provided detailed operational information. • Forecasts were provided to the public via TV Meteorologists, subscribers network, Website. • As power was restored air quality improved.
Ventilation Products • Two Approach’s • PBL x 20m wind averaged (3hr,12,24hr) • Brunt Vaisala Stability averaged (3hr,12,24hr) • Challenges • Describe in plain terms to users • Overly conservative labeling masks degree of ventilation (PBL x 20m wind) • Used by non-meteorologists to make field/forest burning decisions
BV Ventilation is becoming an important forecasting tool • Began analysis in Oct 2006 • Daily evaluation of forecasts vs monitoring data • Applied to PM 2.5 forecasts • Based on 24hr averaged forecasts • Average results across entire PSCAA network • Objective determine significance of indices intervals
BV Ventilation is becoming an important forecasting tool • Preliminary results • BV Indices • 100% if >800= PM 2.5 < 15ugm3 (Good AQI) • 89% if >400 = PM 2.5 < 15ugm3 (Good AQI) • 74% if < 400 = PM 2.5 > 15ugm3 (Moderate AQI) • 34% if < 200= PM2.5 > 35ugm3(USG AQI) • 44% if < 150 = Pm2.5 > 35ugm3 (USG AQI)
BV Ventilation • Potential Ventilation Categories • Based 24 hour averages for single days • > 800 = Excellent Ventilation • > 400 = Good Ventilation • > 200 = Limited Ventilation • > 100 = Poor Ventilation • < 100 = Very Poor
Operational Products • http://www.atmos.washington.edu/mm5rt/ • http://www.atmos.washington.edu/mm5rt/descript/descript_main.html • http://www.atmos.washington.edu/mm5rt/rt/gfsinit.aq.html • http://www.atmos.washington.edu/mm5rt/extendedgfsinit.html • http://www.atmos.washington.edu/mm5rt/rt/soundings_d2.cgi?GFS+current_gfs+ps