IPC Warm Ups
280 likes | 422 Views
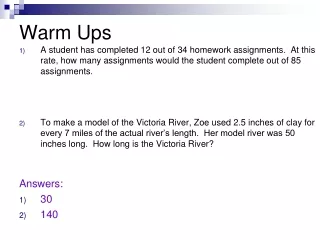
IPC Warm Ups. Feb 2, 2009. TEKS. 2C Organize, analyze, evaluate, make inferences, and predict trends from data. Number 1. A B C D. Number 2. A B C D. Number 3. A B C D. Number 4. Number 5. TAKS. Warm-ups. TEKS 2D.

IPC Warm Ups
E N D
Presentation Transcript
IPC Warm Ups Feb 2, 2009
TEKS 2C Organize, analyze, evaluate, make inferences, and predict trends from data.
Number 1 A B C D
Number 2 A B C D
Number 3 A B C D
TAKS Warm-ups
TEKS 2D • The student uses scientific methods during field and laboratory investigations. The student is expected to communicate valid conclusions.
#1 • Which conclusion is best supported by these data? • Earth’s surface is composed mostly of silicon and calcium. • Oxygen is closer to Earth’s surface than aluminum • There is more aluminum than calcium at the Earth’s surface. • Silicon is much heavier than iron at Earth’s surface. Most Abundant Elements at Earth’s Surface
Ten different types of culture media were inoculated with the same strain of bacteria and incubated at the same temperature. Nine of the cultures grew. Which of these conclusions can be drawn from this information? #2 • The media used in the experiment are all capable of sustaining bacterial growth. • The temperature varied greatly during the experiment. • Only the culture that failed to grow bacteria was inoculated properly. • One of the media lacked the nutrients needed for the bacteria to grow.
In an investigation 10,000 dung beetles were examined for the presence of parasites. The data showed that about 5% of the beetles had parasites. The results are • Invalid because only dung beetles were examined. • Unsupported because the parasite population was small. • Erroneous because more beetles should have had parasites. • Valid because the sample size was sufficient for accuracy. #3
Animal Length of digestive system Diet category Animal weight Koala 305 cm herbivore 10 kg Dog 135 cm carnivore 11 kg Rabbit 272 cm herbivore 9 kg Bobcat 145 cm carnivore 12 kg • Herbivores are animals that eat plants. Carnivores are animals that eat other animals. The table shows data about several herbivores and carnivores. What conclusion can you draw from the data? • There is no correlation between diet and length of digestive • system. • B. Herbivores have longer digestive systems than carnivores. • C. Carnivores have longer digestive systems than herbivores. • D. The length of the digestive system is related to the weight of an animal. #4
Animal Length of digestive system Diet category Animal weight Koala 305 cm herbivore 10 kg Dog 135 cm carnivore 11 kg Rabbit 272 cm herbivore 9 kg Bobcat 145 cm carnivore 12 kg What is the average weight of the animals in the table? a) 9.5 kg b)10.5 kg c) 22 kg d) 42 kg #5
TEKS Objective • 4. A calculate speed and average speed • 2.C organize, analyze, evaluate, make inferences, and predict trends from data
1. A car traveled 50 meters in 10 seconds. What speed is the car traveling? • A. 5 m/s • B. 500 m/s • C. 0.50 m/s d s t X
2. A baseball is thrown at a speed of 2 m/s, and travels for 3 seconds. How far did it travel? • A. 0.5 m • B. 6 m • C. 5 m • D. 1.5 m d s t X
3. A soccer ball is kicked towards the goal 10 m away at a speed of 2 m/s. How long does it take for the ball to roll into the goal? • A. 12 s • B. 0.5 s • C. 5 s • D. 20 s d s t X
5. From the distance time graph which graph shows an object at rest d d t t A B
Students will be expected to: • analyzing speed graphs [4.A] • organize, analyze, evaluate, make inferences, and predict trends from data.[2.C]
The graph below was taken from the laboratory notebook of a physics student. The graph shows- • An object increasing in speed • An object at rest • An object accelerating • An object decreasing in speed Speed (m/s) 1
The graph below shows- • An object traveling at a constant speed • An object at rest • An object accelerating • An object decreasing in speed 2
April collected the data in the table below as a toy car rolled along a meter stick on a small incline. Predict the time it will take the car to reach a speed of 20 cm/s. • 10 s • 8.0 s • 9.5 s • 10.5 s 3
Which graph best shows the comparison of the elements to the total composition of the copper ore? A B C 4
The diagram represents the total travel of a teacher on a Saturday. Which part of the trip is made at the greatest average speed? A. Q B. R C. S D. T 5