Download
1 / 19
190 likes | 307 Views
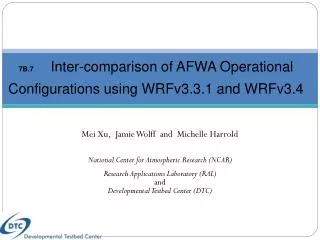
7B.7 Inter-comparison of AFWA Operational Configurations using WRFv3.3.1 and WRFv3.4. Mei Xu , Jamie Wolff and Michelle Harrold National Center for Atmospheric Research (NCAR) Research Applications Laboratory (RAL) and Developmental Testbed Center (DTC). AFWA Configuration Testing.

E N D
7B.7 Inter-comparison of AFWA Operational Configurations using WRFv3.3.1 and WRFv3.4 Mei Xu, Jamie Wolff and Michelle Harrold National Center for Atmospheric Research (NCAR) Research Applications Laboratory (RAL) and Developmental Testbed Center (DTC)
AFWA Configuration Testing DTC 2012 AFWA testing and evaluation • Impact assessment of WRF-ARW version upgrade (WRFv3.3.1/WRFv3.4) • Performance assessment of two land surface input data sets (LIS2.7.1/LIS3.3) in a functionally similar operational environment • Data assimilation (WRFDA 3DVAR) and 6-hr warm start • AFWA operational input datasets • AFWA operational namelist options
AFWA Configuration Testing GFS AGRMET WPS - 6 hr 00 hr Navy SST WRF input/bc WRF input/bc WRF output WRF input/bc Update BC Update BC 6 hr WRF forecast 48 hr WRF forecast WRFDA output WRFDA output WRFDA WRFDA Seasonal BE were generated from 2-week-long cold-start runs BE dataset OBS .INIT BE dataset OBS .FCST Flowchart of the 6-hr “warm start” spin-up
Experimental Design • End-to-end system: WPS, WRFDA, WRF, UPP, and MET • Test Period: 1 July 2011 – 29 June 2012 48-h warm start forecasts initialized every 36 h (244 cases) • Domain: single 15-km CONUS grid 56 vertical levels • Numerical experiments: • WRFDAv3.3.1 + WRFv3.3.1 w/ LoBCs from LIS w/ Noahv2.7.1 • WRFDAv3.4 + WRFv3.4 w/ LoBCs from LIS w/ Noahv2.7.1 • WRFDAv3.4 + WRFv3.4 w/ LoBCs from LIS w/ Noahv3.3
Evaluation Matrix • Surface and Upper Air [(BC)RMSE, bias] Temperature, Dew Point Temperature, Wind speed • Precipitation (Gilbert skill score, frequency bias)3-h and 24-h accumulations (vs. Stage II analysis) • GO Indexweighted RMSE across variables, domain and lead time • Statistical Assessment • confidence intervals (CI) at the 99% level • statistical significance (SS) and practical significance (PS)
Surface Verification: Bias v3.4-v3.3.1 00 UTC initialization surface temperature surface dew point temp day 1 day 2 v3.4: colder – larger cold bias overnight daytime overnight daytime surface wind speed v3.4: colder during cold-bias hours, warmer during warm-bias hours – larger bias v3.4: smaller high bias; no differences are PS overnight daytime overnight daytime
Surface Verification: Bias v3.4-v3.3.1 00 UTC initialization surface temperature day 1 day 2 v3.4: colder – larger cold bias A bug was found last week in the Prepbufr datasets used for verification, which may have exaggerated the cold temperature bias, especially for summer.
Surface Temperature: Bias WRF v3.3.1 00 UTC 12 h forecast 00 UTC 48 h forecast cold bias cold bias valid at 12 UTC valid at 00 UTC
Surface Temperature: Bias WRF v3.4 00 UTC 12 h forecast 00 UTC 48 h forecast cold bias cold bias valid at 12 UTC valid at 00 UTC
Surface Temperature: Bias |v3.4|– |v3.3.1| 00 UTC 12 h forecast 00 UTC 48 h forecast v3.4 betterv3.3.1 better v3.4 betterv3.3.1 better valid at 12 UTC valid at 00 UTC
Surface Dew Point: Bias WRF v3.3.1 00 UTC 12 h forecast 00 UTC 48 h forecast cold / dry bias warm / wet bias valid at 12 UTC valid at 00 UTC
Surface Dew Point: Bias WRF v3.4 00 UTC 12 h forecast 00 UTC 48 h forecast cold / dry bias warm / wet bias valid at 12 UTC valid at 00 UTC
Surface Dew Point: Bias |v3.4|– |v3.3.1| 00 UTC 12 h forecast 00 UTC 48 h forecast v3.4 betterv3.3.1 better v3.4 betterv3.3.1 better valid at 12 UTC valid at 00 UTC
Surface Temperature: Bias v3.4vsv3.3.1 pair-wisedifferences for bias by initialization time, lead time, and season 00 UTC 12 UTC • SS (light shading) and PS (dark shading)
Surface Dew Point: Bias v3.4vsv3.3.1 pair-wisedifferences for biasby initialization time, lead time, and season 00 UTC 12 UTC • SS (light shading) and PS (dark shading)
Upper Air Temperature: v3.4vsv3.3.1 pair-wisedifferences for RMSE and bias by initialization time, lead time, and season Annual Summer Winter v3.4 temp is generally colder – smaller warm bias at upper levels except 150 mb
GO Index: v3.4 vsv3.3.1 • v3.3.1 more skillful during summer • v3.4 more skillful during winter • comparative for annual, spring and fall • outlier cases: v3.3.1 better than v3.4 summer winter N<1 baseline configuration has higher skill N>1comparison configuration has higher skill.
Summary of Results • Most PS pair-wise differences are noted in temperature and dew point temperature bias • Surface temperature and dew point: WRFv3.3.1 is generally favored. • Upper air temperature: Mixed results dependent on vertical levels. • No PS pair-wise differences are noted in wind speed.The SS differences favor WRFv3.4. • No SS differences are noted in precipitation skills. • GO Index: WRFv3.3.1 is more skillful during summer, and WRFv3.4 is more skillful during winter
http://www.dtcenter.org/config/ v3.4 v3.3.1 THANK YOU!