Download
1 / 28
280 likes | 420 Views
Status of the PrimEx Experiment at JLab : A Precision Measurement of the Neutral Pion Lifetime. Yelena Prok MIT For the PrimEx Collaboration The 2006 Photonuclear Gordon Research Conference August 1, 2006. Outline. Physics Motivation The Primakoff Effect Experimental Setup

E N D
Status of the PrimEx Experiment at JLab:A Precision Measurement of the Neutral Pion Lifetime Yelena Prok MIT For the PrimEx Collaboration The 2006 Photonuclear Gordon Research Conference August 1, 2006
Outline • Physics Motivation • The Primakoff Effect • Experimental Setup • Compton Scattering on Electrons • Preliminary 0 Analysis • Summary and Outlook
Chiral Anomaly The p0 decay rate is a fundamental prediction of confinement scale QCD. Chiral Anomaly – the closed-loop triangle diagram results in axial vector current non-conservation, even in the limit of vanishing quark masses. The anomaly leads to the reduced decay amplitude, in leading order (chiral limit) where Fp = 92.42+/-0.25 MeV is the pion decay constant.
Decay Width The p0ggg decay width is related to the amplitude: is presently known to 10% The goal of the Primex Experiment is to measure the decay width to an accuracy of 1.5%. Test axial anomaly and next to leading order PT
Primakoff Effect • The 0 photoproduction from Coulomb field of the nucleus. • Production (*!0) and decay (0!) mechanisms imply the Primakoff cross section is proportional to the 0 lifetime.
Cross Section Components Primakoff Nuclear Coherent Nuclear Incoherent Interference Primakoff photoproduction from a Coulomb field of a nucleus ~ Z2, peak at =m2/2E2 Nuclear Coherentnucleus left in the ground state, peak at ~2/ER, ~ A2 Nuclear Incoherentnucleus left in excited state, which may be either bound or particle unstable , ~ A Interferencebetween the Primakoff process and the coherent non-spin-flip nuclear photoproduction
Jefferson Lab The Primex Experiment was conducted at Jefferson Lab. The measurement was taken in Hall B using the photon tagging system. The CLAS detector was not employed. Instead, a new detector was designed and installed specifically for the Primex Experiment.
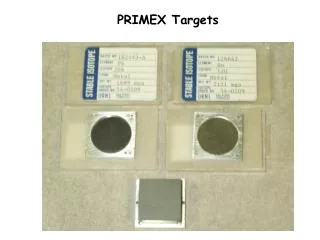
PrimEx Setup in Hall B Tagged photons of energy 4.9-5.5 GeV were used to measure the absolute cross section of small angle 0 photoproduction from 12C and 208Pb targets
HYbrid CALorimeter HYCAL • Hybrid calorimeter was • designed and installed to • detect the 2 decay photons • Central Part: PbWO4 x 1152 ch • E/E ~ 1.2 % at 2.5 GeV • x ~ 1.55 mm • Outer part: Lead Glass x 576 ch • E/E ~ 5 % at 2.5 GeV • x ~ 5 mm • Light Monitoring System : • 10-20 Hz sampling of the PMT gains 4 cm x 4 cm beam hole
Compton Scattering off Atomic Electrons • Well known process, can be used for systematic studies of experimental setup • Data is used for: • Detector alignment • Monitoring of HYCAL gain drifts with time • Calculation of absolute cross section Periodic Compton Runs 1st calibration 2nd calibration 10/09 11/22 Production runs throughout
Compton Scattering off Atomic Electrons e! e • Compton scattering at small angles • Targets: 5 % r.l 12C, 0.5 % r.l.9Be • What we measure: • Incident photon energy • Energy and position of the • scattered particles • Double Arm Compton Data: • BPS=0, I=5 nA • detect both particles, • dedicated runs • Single Arm Compton Data: • by-product of the 0 production runs • only scattered photons are detected LG scattered e- incident PWO scattered ’ LG
Double Arm Compton Event Compton event in “primsim” target Helium Bag Veto counters HYCAL 2 clusters are detected on the calorimeter
Monitoring Beam Position: DA Compton data (1+2)/2 Looking for an intersection point between lines connecting Compton e- and by minimizing the sum of squares of distances between a point (x0,y0) and each line (1-2)/2 (deg)
Monitoring Energy Gains: DA Compton Data Module 1498 Using photons Gain_Corr = 1.038 » 3.8 % e/ec Energy Resolution after “Compton” energy of the photons/electrons can be calculated from the Compton kinematics: ec=E/[1+2E/me*sin2((el)/2)] Can obtain gain correction factor by looking at the ratios of the measured and expected energies: e/ec before (e1+e2)/E
DA Compton: Event Selection (Be target) Reconstruct the vertex of Compton reaction Z=(x2+y2)0.5[/(E/e-1)]0.5 Apply kinematic constraints: energy and momentum conservation Reconstruct Z again Z (cm) 2<100 removes most of the background He bag
DA Compton: Extracting the Cross Section very preliminary very preliminary error bars are statistical only radiative corrections are not applied
0 production on 12C Events/0.04 deg
0 production on 208Pb Events/0.04 deg
Summary and Outlook • The PrimEx experiment collected 0 production data on 12C and 208Pb • Analysis of Compton scattering provides a useful tool for monitoring of experimental conditions • Preliminary analysis of Double Arm Compton Cross Section is in good agreement with theory • More systematic checks and radiative corrections are needed for the Compton scattering analysis • Items on the Primakoff 0 production to be completed: • Finalize 0 yields and normalize to photon flux • Extract 0! by fitting latest theoretical models to dN/d distribution. The models will be corrected for acceptance and efficiencies of the experiment Many thanks to people who provided plots and advice
Monitoring Beam Position: SA Compton Data Xcompton=(2/*z2(E/e-1)-y2)0.5 Ycompton=(2/*z2(E/e-1)-x2)0.5 =E/me Relative beam-HYCAL position can be checked every ~ 10 min of data taking
DA Compton: Counting Events 9Be, MC 12C, MC 9Be data 12C data Events/2 Events/2 Vertex Z1 (cm) Vertex Z1 (cm)
Monitoring Energy Gains: SA Compton Data carbon lead Using single arm compton data in the production runs allows for run-by run gain monitoring Compton gains are consistent with the Light Monitoring System
Primakoff Cross Section • Gpgggis the pion decay width. • aem is fine structure constant. • Z is the number of protons in the nucleus. • mp,b,qpare the pion mass, velocity, and production angle. • E is the incoming photon energy. • Q is the momentum transfer to the nucleus. • Fem(Q) is the electromagnetic form factor of the nucleus. Coherent Cross Section Incoherent Cross Section • A is the number of nucleons. • Csin2(qp) is the spin independent part • of the p0 photoproduction amplitude from • a single nucleon. • FN(Q) is the nuclear form factor of the • nucleus mass distribution. • x is an absorption factor. • 1-G(Q) is a factor that reduces the • cross section at small Q. • dsH/dWis the 0 photoproduction • cross section on a single nucleon.
DA Compton: Extracting the Cross Section Total Cross Section (per electron) • T=N/(L*F*A*) • N=nevents • L=luminosity=*t*NA/ • t=target thickness • =target density • NA=Avogadro’s Number • =atomic mass • =efficiency (from MC) • A=atomic number • F=photon flux • Error bars are statistical only • Radiative corrections are not applied very preliminary
Decay Width The p0ggg decay width is related to the amplitude: The Particle Data Group value is 7.84+/-0.56 eV. The Next to Leading order prediction is 8.10+/- 1% which is 4% higher than the present experimental value. The goal of the Primex Experiment is to measure the decay width to an accuracy of 1.5%.