Download
1 / 29
290 likes | 467 Views
USING VM and FPS TO PREPARE A FRAMEWORK FOR THE DEVELOPMENT OF A COMPREHENSIVE TRAFFIC VOLUME INFORMATION SYSTEM. Presented by Lucie Parrot, eng. CVS Tom Fletcher, P.Eng., CVS. Thomas W. Fletcher, P.Eng., CVS.

E N D
USING VM and FPS TO PREPARE A FRAMEWORK FOR THE DEVELOPMENT OF A COMPREHENSIVE TRAFFIC VOLUMEINFORMATION SYSTEM Presented by Lucie Parrot, eng. CVS Tom Fletcher, P.Eng., CVS
Thomas W. Fletcher, P.Eng., CVS • 29 year career at the Ministry of Transportation, Ontario (MTO) including Senior Value Engineer • established the Fletcher Group in 1999 • past president of the Canadian Society for Value Analysis. • currently director responsible for business liaison with SAVE International.
Lucie Parrot, eng.,M.eng., CSI, CVS • industrial engineer with over 25 years of experience • involved in product development projects • award for her “outstanding contribution” from the Canadian Society for Value Analysis. • with the society since its beginning
Agenda • Context • Mandate • Approach • Methodology • Results
MTO context • successfully used the VE Methodology, since 1998on design projects of highways • savings in excess of $100 Millions • limited use in other business areas • develop a new framework for an expanded and updated Traffic Volume Information System (TVIS2)
Mandate • analyse the functions of 6 existing legacy systems, • incorporate new required functions • eliminate redundant functions • evaluate potential options / FPS • highlight weaknesses in current business processes • Decide: acquire or develop of new system.
Network • 16477 km of highways • collection of data is done on a few specific road sections on a continuous basis • remainder of the sections according to a three year program. • One of the most important statistics AADT- Average Annual Daily Traffic.
Responsibilities • Head Office : • the permanent counting program • publication of traffic volume data and statistics. • Regional Traffic Offices: • collecting and processing of sectional traffic data on highway network • review of the preliminary data prior to the publication by Head Office.
Actual systems • Inventory Count Management System (ICMS) • Regional Traffic Information System (RTIS) • Noon-to-Noon File Management System (NNFMS) • Permanent Counting Stations (PCS) • Matching Program (PCSFIT) • Traffic Volume Information System (TVIS)
Situation • antiquated and need to be replaced. • written in 16-bit DOS, FORTRAN, dBaseIII+, and Better Basic • Some are mainframe applications while others are for stand alone PC applications that will not work in a modern computer environment
Comparison • publication of current traffic statistics is delayed by over 1 year. • US DOT’s are required to publish federally reported traffic data within 90 days of year end.
Approach • Arrange Stakeholder workshops and user interviews facilitated by a CVS resulting in a functional tree and draft FPS • Prepare final Functional Performance Specification • Prepare a detailed questionnaire based on the FPS to interview 15 selected transportation agencies • Short List and visit 3 agencies for detailed analysis • Prepare report on findings and preferred solution from agencies / FPS • VE of business processes
Methodology • Analyze the functions of current processing systems in order to identify what needs to be included in the next generation system. • Identify functions of a higher level, by looking at the outside influence factors that have an impact on the design of the new TVIS2 system. (environmental analysis) • Organize functions in a functional diagram & FPS.
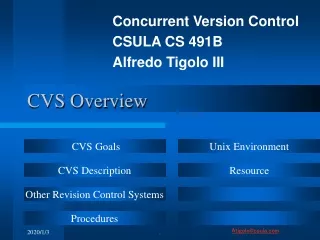
Design strategy ADVISED CLIENT MARKET RESEARCH V A L U E E N G PRODUCTION NEED DETAIL ENGINEERING FUNCTION ANALYSIS CONCEPTUAL DESIGN DESIGN TO COST FUNCTIONAL PERFORMANCE SPECIFICATION FMEA EVALUATION
Functional diagram TVIS2
DETERMINE THE NEEDS • creation of a program scheduleaccording to rules set by frequency, dates, duration and method of collection including time intervals • maintenance or construction work must be known • inventory of sensors and equipment • add ad-hoc count requests • query and revision of the program
COLLECT / RETRIEVE DATA • programming, collecting/recording and retrieving of data recorded by monitoring equipment • upload and download information • stamp for time, location and type of equipment used, for traceability and for quality of data purposes • data entry screens
ENSURE QUALITY OF PROCESS • assessing integrity and quality of the acquired data • errors and anomalies are identified and edited • New: authentication of data and tracking of level of confidence
PROCESS DATA • calculations, statistics, spreadsheets and graphs are prepared • match data to curves by pattern types • Projections done for uncounted locations • Estimates are also prepared • warrants are calculated
MAKE RESULTS AVAILABLE • preparation of reports • export of data • publication of information • help the users make good decisions • Real time data should be available
ENSURE RELIABILITY AND CONTINUITY OF SYSTEM • respect standards and MTO architecture • Supportusers and owners • manage the system • legacy data need always to be available • make sure no suspicious or malicious activities take place
Cost analysis Item Cost % of Project • Collect-retrieve data $ 752 000 33,6% • Make results available $ 572 000 25,6% • Process edited data $ 306 000 13,7% • Ensure quality of process $ 267 000 11,9% • Planning/ Determine the needs $ 190 000 8,5% • Ensure reliability and continuity $ 148 000 6,6% $ 2 235 000
Number Function Criteria Level Flex Comments 1.1.1.1 Keep track of counts history forever F0 It is important to be able to eventually go back to any year archives After 20 years F0 Anything before that is available at any time 3.1.2 Monitor collection process View of data 15 minutes F1 Communication achieved Yes or no F1 4.5.3.3 Select best suited curve Number of best choices 5 F1 Example from FPS
Functional diagram TVIS2
Candidate Agencies • Province of Alberta • California Department of Transportation (CalTrans) • British Columbia MOT (BCMOT) • Chaparral Systems ** • Florida DOT (FDOT) • Maryland (MSHA)* • Minnesota DOT (MnDOT) • North Carolina DOT (NCDOT) • Ohio DOT (OHDOT) • Pennsylvania DOT (Penn DOT)* • Quebec MOT • Texas DOT • City of Toronto* • Vermont Agency of Transportation (VAOT)* • Virginia (DOT)
3 options • Utilize a current US-DOT Traffic Monitoring System as a basis for the new TVIS2 System • Purchase a Commercial Off the Shelf Traffic Monitoring system • Develop a new system based on the FPS developed for this project
System’s Integration First opportunity for system IT staff to evaluate FPS as tool. Itwas concluded that this provided many valuable opportunities to bridge the gap between user and application developer.