Download
1 / 63
630 likes | 794 Views
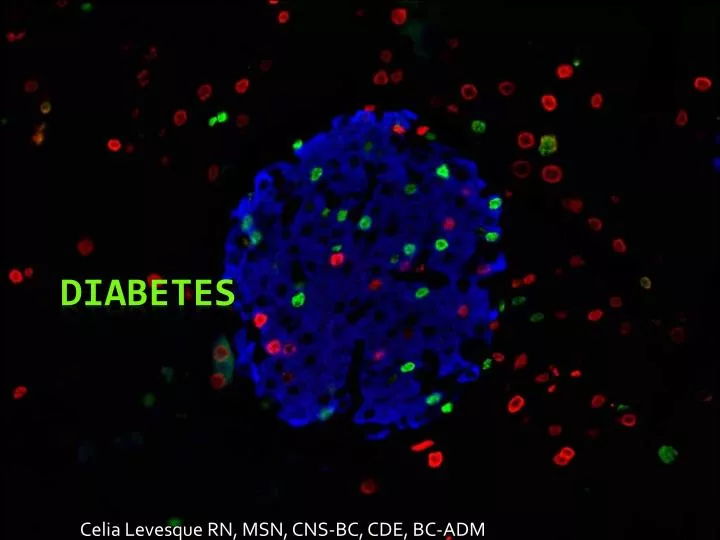
Celia Levesque RN, MSN, CNS-BC, CDE, BC-ADM. Diabetes. Pancreas. Digestive enzymes (acini) Hormones (Islets of Langerhans) Insulin Glucagon Amylin Somatostatin Pancreatic polypeptide. Islets of Langerhans. 1-2 million, 0.3 mm Major cell types: Alpha (25%): secretes glucagon

E N D
Pancreas • Digestive enzymes (acini) • Hormones (Islets of Langerhans) • Insulin • Glucagon • Amylin • Somatostatin • Pancreatic polypeptide
Islets of Langerhans • 1-2 million, 0.3 mm • Major cell types: • Alpha (25%): secretes glucagon • Beta (60%): secretes insulin and amylin • Delta (10%) secretes somatostatin • PP cell (5%): pancreatic polypeptide
Insulin • Secreted by beta cells • Insulin preprohormone • Proinsulin (no insulin activity) • Insulin • C-peptide • Plasma half-life: 6 minutes • Cleared from circulation 10-15 min
Insulin • Degraded by insulinase • Binds with and activates a membrane receptor protein • Receptor (not insulin) causes complex series of reactions that cause glucose to be transported
Insulin • Promotes uptake, storage, and use of glucose in the liver • Glycogen is the stored form of glucose • Glycogen is converted back to glucose between meals • Decreased blood glucose causes inhibition of insulin release
Insulin Receptor • Binds with -subunit of its receptor • Causes autophosphorylation of the ß-subunit receptor • Induces tyrosine kinase activity which begins a cascade of cell phosphorylation • Increases or decreases the activity of enzymes that mediate effects of glucose on glucose, fat and protein metabolism
Glucagon • Secreted by alpha cells • Raises BG • Activates hepatic gluconeogenesis • Converts glycogen to glucose
Glucagon Release Triggers Inhibitors • Excess consumption of amino acids • Exercise • Low insulin levels • In non-DM: BG <70 mg/dl • Insulin • Somatostatin • Amylin
Amylin • Co-secreted from beta cells • Delays gastric emptying • Inhibits glucagon release
Glucagon-like Peptide (L cells) Increases Decreases • Insulin release in a glucose dependent manor • Beta cell mass • Insulin gene expression • Satiety • Insulin sensitivity • Glucagon • Acid secretion • Gastric emptying
Gastric Inhibitory Polypeptide • Glucose-dependent insulinotropic peptide • Induces insulin secretion, which is primarily stimulated by hyperosmolarity of glucose in the duodenum • Amount of insulin secreted is greater when glucose is administered orally than intravenously.
Brain • Insulin has little effect on uptake and use of glucose • Permeable to glucose and can use glucose without insulin • Sensitive to hypoglycemia
2008 1994 2000 2008 1994 2000 No Data <4.5% 4.5-5.9% 6.0-7.4% 7.5-8.9% >9.0% No Data <14.0% 14.0-17.9% 18.0-21.9% 22.0-25.9% >26.0% Age-adjusted Percentage of U.S. Adults Who Were Obese or Who Had Diagnosed Diabetes Obesity (BMI ≥30 kg/m2) Diabetes CDC’s Division of Diabetes Translation. National Diabetes Surveillance System available at http://www.cdc.gov/diabetes/statistics
TOO THIN TOO FAT
Signs and Symptoms • Polyuria • Polydipsia • Polyphagia • Weight loss • Blurred vision • Irritability • Fatigue
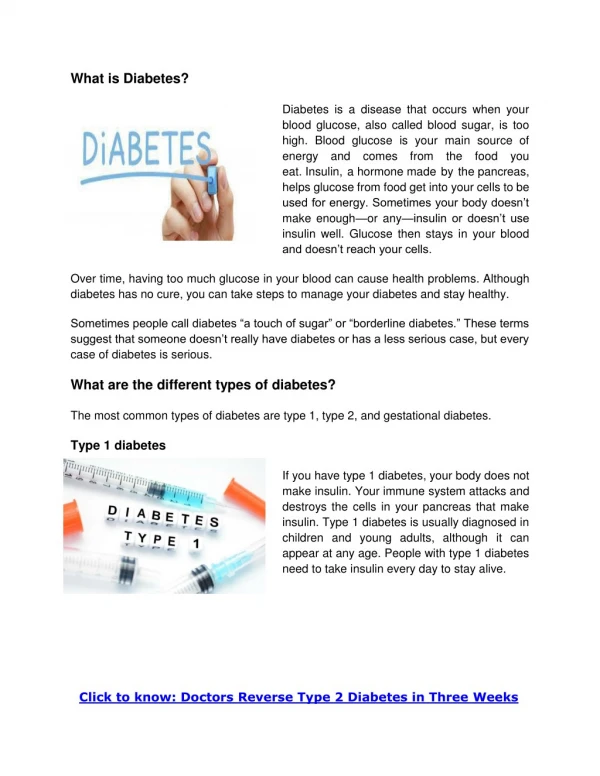
Classification • Type 1 • Type 2 • MODY • Secondary diabetes • Gestational diabetes mellitus (GDM) • Other
T1DM Prevalence in US • > 13,000/year new dx • Increasing 3%/yr since 1950 • 1 in 400-600 • < 4 yo: 7 per 100,000 • 5-9 yo: 15 per 100,000 • 10-14 yo: 22 per 100,000 • Offspring of T1DM: 1 in 20-50
J.L. Before Insulin • Age 3 • Weight 15 lbs. • December 15, 1922
J.L. After Insulin • Feb 15, 1923 • Weight 29 lbs
Natural Hx and Patho of Type 1 • Autoimmune attack of beta cell • Abrupt onset of s/sx • Marked hyperglycemia • Strong propensity for DKA • Disease develops before s/sx • Pathologic and biochemical changes occur as long as 9 yrs before s/sx
Stages of Development of T1DM • Genetic predisposition • Environmental trigger • Active autoimmunity • Progressive beta cell dysfunction • Overt DM mellitus
Genetic Link • Increased risk: • HLA types DR3 or DR4 • 95% have HLA-DQA1*0301, HLA-DQA1*0302 • Decreased risk: • HLA-DQ B-1*0602 • HLA-DQW1.2.
Suspected Triggers • Rubella • Coxsackie B • Sex steroids as seen in puberty and during pregnancy • Environmental toxins (including N-nitroso derivatives and the rodenticide vacor)
Antibody Testing • Islet Cell abx (ICA's) • IAA antiinsulin • GAD65 anti glutamic acid decarboxylase • ICA512 a specific islet cell antibody • Other Genetic Testing that is Uncommonly Done • EMA antiendomysealabx (test for celiac syndrome occurring in 5% of new T1DM) • Anti 21-hydroxylase (test for Addison's disease found in 2% of new onset T1DM)
T2DM Prevalence Type 2 DM increasing prevalence 2002: 0.3% / 2005: 0.6% • .072 per 1000 for African American and Caucasian • 50.9 per 1000 for Pima Indians • 4.5 per 1000 for all Indian populations • 2.3 per 1000 for Canadian First Nation people from Manitoba
Type 2 DM • Heterogeneous disorder • Variable plasma insulin levels • Hyperglycemia • Peripheral insulin resistance • Associated with increased cardiovascular risk
Risk of T2DM • Family hx of T2DM • Obesity • Lack of exercise • Exposure to hyperglycemia in utero
Type 2 DM: Specific Defects • Primary beta cell dysfunction • Insulin receptor abnormalities (rare) • Specific post receptor defects, • altered glucose transporter function • specific enzymatic defects that modulate intracellular insulin activity • Limitation in beta cell response to hyperglycemia
Type 2 DM • 50% reduction in beta cell mass • No autoimmune insulinitis is found in cells • Absence of hypertrophy and hyperfunction caused by chronic hyperglycemia
Features of Insulin Resistance & T2DM • Obesity • Hyperlipidemia • Hypertension • AcanthosisNigricans • Sleep Apnea
Biguanide Sulfonylurea Amylin agonist Glinide GLP-1 agonist Amylin agonist GLP-1 agonist DPP-4 inhibitor α-glucosidase inhibitor Thiazolidinedione
Insulins • Rapid Acting • Short Acting • Intermediate Acting • Long Acting
Rapid Acting Insulin Pharmacodynamics: Medications: • Onset: 15 min • Peak: 30-90 min • Duration: 3-5 h • Lispro (Humalog) • Aspart (Novolog) • Glulisine (Apidra)
Short Acting Insulin Pharmacodynamics: Medications: • Onset: 60 min • Peak: 2-4 hours • Duration: 6-8 h • Novolin R • Humulin R • How supplied • Vial • Pen
Intermediate Acting Insulin Pharmacodynamics: Medications: • Onset: 1-3 hrs • Peak: 6-12 hours • Duration: 12-24 h • Novolin N • Humulin N • NPH Penfill
Long Acting Insulin Pharmacodynamics: Medications: • Onset: 4 hrs • Peak: none • Duration: 16-24 h • Lantus glargine • Levimer: detemir • How supplied • Vial • Pen
Insulin Requirements • Honeymoon: often < 0.5 u/kg/24 h • Prepubertal: 0.6 – 1 u/kg/24 h • Puberty: 1-2 u/kg/24 h • After puberty, dose requirements usually reduce to pre puberty