Download

1 / 50
500 likes | 655 Views
Sangamon County, Illinois: A Guide to Retail. City of Springfield, Illinois Office of Planning & Econ. Development 800 E. Monroe, Room 107 Springfield, IL 62701 Ph. (217) 789-2377 Website: www.springfield.il.us/oped. Springfield, Illinois:

E N D
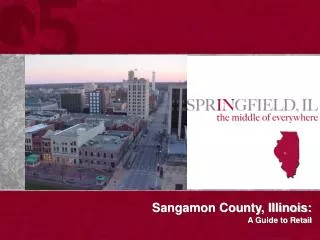
Sangamon County, Illinois: A Guide to Retail
City of Springfield, Illinois Office of Planning & Econ. Development 800 E. Monroe, Room 107 Springfield, IL 62701 Ph. (217) 789-2377 Website: www.springfield.il.us/oped Springfield, Illinois: A Guide to Retail October, 2011 This document was prepared by the Quantum Growth Partnership (Q5). The goal of Q5 is to attract and retain new investment in the area. For more information, contact: The Quantum Growth Partnership 1011 South Second Street Springfield, IL 62704 Ph. (217) 525-1173 Website: www.gscc.org
Trend in Retail Sales for Sangamon County, Illinois 1011 South Second Street Springfield, IL 62704 Ph. (217) 525-1173 Website: www.gscc.org City of Springfield, Illinois Office of Planning & Econ. Development 800 E. Monroe, Room 107 Springfield, IL 62701 Ph. (217) 789-2377 Website: www.springfield.il.us/oped A Guide to Retail Springfield and Sangamon County have nearly 1,800 retail stores and shops, with the majority located in the City of Springfield. Accordingly, Springfield serves as the regional retail center for more than a 40-mile radius from the city. Drawing from an 11-county trade area (Cass, Christian, Greene, Logan, Macon, Macoupin, Menard, Montgomery, Morgan, Sangamon, and Scott counties). White Oaks Mall, the largest enclosed shopping center in Central Illinois, acts as the primary hub for retail activity in the community and is anchored by Bergner's, Macy’s and Sears department stores. J. C. Penney, K-Mart, Kohl's, ShopKo, Wal-Mart, Target, Meijer, Best Buy, Lowe’s and other national chains also are firmly entrenched in the local retail market. Specialty shops abound at more than 20 neighborhood shopping centers and within the Downtown Business District. With more than thirty department stores and eighty local and national grocers, Sangamon County continues to attract more consumers and retailers from a growing geographic region. Total annual retail sales have exceeded $2 billion in the County since 1996, while per capita growth is above and expected to continue to exceed national norms.
Trend in Retail Sales for Sangamon County, Illinois 1011 South Second Street Springfield, IL 62704 Ph. (217) 525-1173 Website: www.gscc.org City of Springfield, Illinois Office of Planning & Econ. Development and Economic Development 800 E. Monroe, Room 107 Springfield, IL 62701 Ph. (217) 789-2377 Website: www.springfield.il.us/oped A Guide to Retail
Springfield Trade Area Demographics Population ‘09 Census Estimate ‘00 Census Population ‘90 Census Population Household Income Dist. (2000) <$14,999 $15,000-$24,999 $25,000-$34,999 $35,000-$49,999 $50,000-$74,999 $75,000-$99,999 $100,000> Households 1990 Census 2000 Census Avg. Median HH Income (‘08) Age Distribution (2000) 0-17 18-24 25-44 45-65 65+ Median Age 524,905 532,978 521,174 15.9% 14.1% 14.5% 18.3% 20.4% 9.1% 7.8% 203,594 213,315 $48,505 24.4% 8.9% 28.2% 23.3% 15.1% 37.8 N 1011 South Second Street Springfield, IL 62704 Ph. (217) 525-1173 Website: www.gscc.org City of Springfield, Illinois Office of Planning & Econ. Development 800 E. Monroe, Room 107 Springfield, IL 62701 Ph. (217) 789-2377 Website: www.springfield.il.us/oped A Guide to Retail The Trade Area for Springfield/Sangamon County consists of the following eleven adjacent counties in Central Illinois: Cass, Christian, Greene, Logan, Macon, Macoupin, Menard, Montgomery, Morgan, Sangamon and Scott.
Site Locations N 1011 South Second Street Springfield, IL 62704 Ph. (217) 525-1173 Website: www.gscc.org City of Springfield, Illinois Office of Planning & Econ. Development 800 E. Monroe, Room 107 Springfield, IL 62701 Ph. (217) 789-2377 Website: www.springfield.il.us/oped A Guide to Retail: Springfield Shopping Centers • Retail Centers • (1) Downtown Springfield……………... • (2) Northfield Shopping Area………….. • (3) South Grand Pointe………..……...... • (4) Capital City Shopping Area…...……. • (5) Park South…………....…………….. • (6) Prairie Crossing……..…….…….….. • (7) Parkway Pointe………........…….….. • (8) White Oaks Mall………......…….…. • (9) MacArthur Blvd Retail Strip……...... • (10)West Wabash……….……..…….…… • (11) Chatham Square & Montvale……..... • (12) Fairhills Shopping Center…………... • (13) Main Street Chatham……………….. • (14) Downtown Sherman………………… • Retail Development Sites • (15) Legacy Pointe………………………. • (16) Jefferson Crossing………………….. • (17) Lincolnwood Development……….... • (18) Iles Junction…………………….…... 1012 14 16 18 20 22 24 26 28 30 32 34 36 14 2 16 3 12 1 9 4 11 8 5 10 18 17 15 7 6 38 40 42 44 13
Location & Economies 3 Miles 5 Miles 1 Mile 31,580 33,344 31,679 31,608 17.4% 15.5% 12.3% 18.1% 20.0% 9.8% 5.3% 1.6% 13,418 13,209 13,220 13,599 $47,493 13.2% 12.0% 13.4% 19.0% 20.8% 14.2% 7.4% 38.1 77,056 83,682 78,810 75,998 19.1% 15.4% 12.3% 15.9% 18.1% 10.1% 6.7% 2.4% 33,198 34,915 33,507 33,062 $50,278 13.5% 12.6% 14.5% 19.2% 20.4% 12.8% 7.2% 36.4 4,194 3,523 3,908 4,061 4.8% 7.6% 10.3% 17.8% 30.6% 20.4% 6.0% 2.5% 1,673 1,219 1,525 1,638 $61,906 13.8% 12.7% 12.0% 21.3% 23.6% 11.9% 4.6% 37.4 Population ’10 Est. Population ‘90 Census Population ’00 Census Population ‘15 Proj. Population Household Income Dist. <$14,999 $15,000-$24,999 $25,000-$34,999 $35,000-$49,999 $50,000-$74,999 $75,000-$99,999 $100,000-$149,999 $150,000> Households 2010 Estimate 1990 Census 2000 Census 2015 Projected Average HH Income Age Distribution 0-9 10-19 20-29 30-44 45-59 60-74 75+ Median Age Population ’10 Est. Population ‘90 Census Population ’00 Census Population ‘15 Proj. Population Household Income Dist. <$14,999 $15,000-$24,999 $25,000-$34,999 $35,000-$49,999 $50,000-$74,999 $75,000-$99,999 $100,000-$149,999 $150,000> Households 2010 Estimate 1990 Census 2000 Census 2015 Projected Average HH Income Age Distribution 0-9 10-19 20-29 30-44 45-59 60-74 75+ Median Age Population ’10 Est. Population ‘90 Census Population ’00 Census Population ‘15 Proj. Population Household Income Dist. <$14,999 $15,000-$24,999 $25,000-$34,999 $35,000-$49,999 $50,000-$74,999 $75,000-$99,999 $100,000-$149,999 $150,000> Households 2010 Estimate 1990 Census 2000 Census 2015 Projected Average HH Income Age Distribution 0-9 10-19 20-29 30-44 45-59 60-74 75+ Median Age N 1011 South Second Street Springfield, IL 62704 Ph. (217) 525-1173 Website: www.gscc.org City of Springfield, Illinois Office of Planning & Econ. Development 800 E. Monroe, Room 107 Springfield, IL 62701 Ph. (217) 789-2377 Website: www.springfield.il.us/oped A Guide to Retail: Northfield Shopping Area Demographics: Northfield Shopping Area Northfield Shopping Area – Home of Wal-Mart Superstore, Lowe's and Menard’s, the Northfield Shopping Area also offers a variety of smaller retail establishments providing everything from motorcycles to cell phones and a host of restaurants.
Marketplace Profile N 1011 South Second Street Springfield, IL 62704 Ph. (217) 525-1173 Website: www.gscc.org City of Springfield, Illinois Office of Planning & Econ. Development 800 E. Monroe, Room 107 Springfield, IL 62701 Ph. (217) 789-2377 Website: www.springfield.il.us/oped A Guide to Retail: Northfield Shopping Area 3,600 Fed Ex Ground Allied Waste Bissell Rd. Site Brinks Security 23,500 Evan’s Cleaners Big-R Ryan’s Steakhouse Wal-Mart Ditch Witch Wendy’s Midwest Technical Institute Menard’s Shared Service Center Tax Increment Financing District 32,300 Culver’s Lowe’s Goodman InterNat’l Buffet R. King’s Subdivision Site Town and Country Bank Legend Retail Chain Restaurant Local Restaurant Convenience/Gas Lodging Grocery Local Retail/Service Banks Office Entertainment Available Sites Traffic Counts in Blue Lincoln Land Development Site Illinois National Bank Steak ‘n Shake Atlanta St. Hickory River Smokehouse Wings Etc Arby’s Put-Put Golf Burger King Hall’s Harley Davidson 25,100 Northfield Center 21,800 21,700 McDonald’s 529000 Sonic
Location & Economies 1 Mile 3 Miles 5 Miles 58,778 67,540 61,469 57,630 22.2% 16.5% 12.6% 15.8% 17.6% 8.2% 4.8% 2.2% 25,655 28,735 26,396 25,417 $46,652 13.8% 12.4% 15.0% 19.3% 19.3% 13.1% 7.1% 35.8 5,359 6,635 5,625 5,198 337% 19.1% 12.5% 15.0% 93% 4.9% 2.6% 2.8% 2,014 2,369 2,069 1,986 $39,156 19.7% 15.9% 13.9% 15.9% 17.4% 12.5% 4.6% 30.1 109,140 117,502 112,385 106,337 16.8% 14.6% 12.3% 15.8% 18.2% 10.6% 8.3% 3.5% 48,680 50,205 49,342 47,880 $55,860 12.5% 11.5% 15.0% 18.6% 20.5% 13.7% 8.1% 38.0 Population ’10 Est. Population ‘90 Census Population ’00 Census Population ‘15 Proj. Population Household Income Dist. <$14,999 $15,000-$24,999 $25,000-$34,999 $35,000-$49,999 $50,000-$74,999 $75,000-$99,999 $100,000-$149,999 $150,000> Households 2010 Estimate 1990 Census 2000 Census 2015 Projected Average HH Income Age Distribution 0-9 10-19 20-29 30-44 45-59 60-74 75+ Median Age Population ’10 Est. Population ‘90 Census Population ’00 Census Population ‘15 Proj. Population Household Income Dist. <$14,999 $15,000-$24,999 $25,000-$34,999 $35,000-$49,999 $50,000-$74,999 $75,000-$99,999 $100,000-$149,999 $150,000> Households 2010 Estimate 1990 Census 2000 Census 2015 Projected Average HH Income Age Distribution 0-9 10-19 20-29 30-44 45-59 60-74 75+ Median Age Population ’10 Est. Population ‘90 Census Population ’00 Census Population ‘15 Proj. Population Household Income Dist. <$14,999 $15,000-$24,999 $25,000-$34,999 $35,000-$49,999 $50,000-$74,999 $75,000-$99,999 $100,000-$149,999 $150,000> Households 2010 Estimate 1990 Census 2000 Census 2015 Projected Average HH Income Age Distribution 0-9 10-19 20-29 30-44 45-59 60-74 75+ Median Age N 1011 South Second Street Springfield, IL 62704 Ph. (217) 525-1173 Website: www.gscc.org City of Springfield, Illinois Office of Planning & Econ. Development 800 E. Monroe, Room 107 Springfield, IL 62701 Ph. (217) 789-2377 Website: www.springfield.il.us/oped A Guide to Retail: South Grand Pointe Demographics: South Grand Pointe South Grand Pointe – Located on the city’s east side with great access to Interstate 55, South Grand Pointe is home to JC Penny’s, Shop-N-Save, several hotels, a variety of auto dealerships, and many small retail establishments.
Marketplace Profile N 1011 South Second Street Springfield, IL 62704 Ph. (217) 525-1173 Website: www.gscc.org City of Springfield, Illinois Office of Planning & Econ. Development 800 E. Monroe, Room 107 Springfield, IL 62701 Ph. (217) 789-2377 Website: www.springfield.il.us/oped A Guide to Retail: South Grand Pointe 51,300 7,900 20,700 South Grand Pointe JC Penny’s Sang. Co. Super 8 Motel 15,400 Advance Auto Parts AutoZone Shop ‘n Save Dirksen Business Park Legend Retail Chain Restaurant Local Restaurant Convenience/Gas Lodging Grocery Local Retail/Service Banks Office Entertainment Available Sites Traffic Counts in Blue 17,300 17,000 51,300 Illinois Dept. of Transportation
Location & Economies 1 Mile 3 Miles 5 Miles 35,909 38,950 36,908 35,396 19.9% 15.5% 12.2% 15.1% 18.0% 10.1% 6.0% 3.2% 15,030 15,908 15,191 14,952 $51,339 14.3% 12.8% 14.7% 18.8% 19.7% 13.1% 6.6% 35.5 3,968 3,382 3,910 4,021 15.2% 12.0% 11.2% 13.1% 23.6% 12.3% 6.6% 6.0% 1,603 1,356 1,559 1,630 $62,245 14.4% 12.9% 13.0% 18.5% 22.1% 13.7% 5.5% 37.3 98,460 104,651 100,738 96,860 17.3% 14.2% 12.1% 15.4% 18.4% 10.6% 8.6% 3.5% 43,485 44,417 43,853 43,130 $56,437 12.8% 11.8% 14.8% 18.9% 20.5% 13.5% 7.7% 37.5 Population ’10 Est. Population ‘90 Census Population ’00 Census Population ‘15 Proj. Population Household Income Dist. <$14,999 $15,000-$24,999 $25,000-$34,999 $35,000-$49,999 $50,000-$74,999 $75,000-$99,999 $100,000-$149,999 $150,000> Households 2010 Estimate 1990 Census 2000 Census 2015 Projected Average HH Income Age Distribution 0-9 10-19 20-29 30-44 45-59 60-74 75+ Median Age Population ’10 Est. Population ‘90 Census Population ’00 Census Population ‘15 Proj. Population Household Income Dist. <$14,999 $15,000-$24,999 $25,000-$34,999 $35,000-$49,999 $50,000-$74,999 $75,000-$99,999 $100,000-$149,999 $150,000> Households 2010 Estimate 1990 Census 2000 Census 2015 Projected Average HH Income Age Distribution 0-9 10-19 20-29 30-44 45-59 60-74 75+ Median Age Population ‘10 Est. Population ‘90 Census Population ’00 Census Population ‘15 Proj. Population Household Income Dist. <$14,999 $15,000-$24,999 $25,000-$34,999 $35,000-$49,999 $50,000-$74,999 $75,000-$99,999 $100,000-$149,999 $150,000> Households 2010 Estimate 1990 Census 2000 Census 2015 Projected Average HH Income Age Distribution 0-9 10-19 20-29 30-44 45-59 60-74 75+ Median Age N 1011 South Second Street Springfield, IL 62704 Ph. (217) 525-1173 Website: www.gscc.org City of Springfield, Illinois Office of Planning & Econ. Development 800 E. Monroe, Room 107 Springfield, IL 62701 Ph. (217) 789-2377 Website: www.springfield.il.us/oped A Guide to Retail: Capital City Shopping Area Demographics: Capital City Shopping Area Capital City Shopping Area – With easy access to Interstate 55/72, Capital City is located in a highly visible/high traffic area. Anchored by Shopko and Big Lots, Capital City offers a variety of shopping and dining opportunities, as well as an 8-screen movie theatre. Many of the nearby hotels contain meeting/convention space, bringing shoppers and visitors from outside the Springfield area.
Marketplace Profile Legend Retail Chain Restaurant Local Restaurant Convenience/Gas Lodging Grocery Local Retail/Service Banks Office Entertainment Available Sites Traffic Counts in Blue N 1011 South Second Street Springfield, IL 62704 Ph. (217) 525-1173 Website: www.gscc.org City of Springfield, Illinois Office of Planning & Econ. Development 800 E. Monroe, Room 107 Springfield, IL 62701 Ph. (217) 789-2377 Website: www.springfield.il.us/oped A Guide to Retail: Capital City Shopping Area Candlewood Suites Advantage Auto Carlos O’Kelly’s Comfort Inn Applebee’s Cheddar’s Whitney Business Park Smokey Bone’s I.H.O.P. Outback Steakhouse Microtel Inn 8,000 Hooter’s Secretary of State Red Lobster Long John Silver’s Crowne Plaza Hotel Showplace 8 Theatre Holiday Inn Express Capital City Shopping Center Arby’s 47,600 Hilton Garden Inn Shopko Radio Shack Gallina Pizza Jo-Ann Fabrics Dollar General GNC AT&T Wireless Hallmark Taste of Thai Big Lots Panera 13,300 McDonald’s Drury Inn Mavrick’s Steak House IL Realtors Plaza Steak ‘n Shake Hampton Inn 12,100 Pear Tree Inn Walgreen’s CVS Denny’s 21,100 Days Inn
Location & Economies 1 Mile 3 Miles 5 Miles 56,823 62,074 59,468 54,929 17.6% 14.7% 12.2% 15.1% 18.1% 10.4% 8.3% 3.6% 25,675 27,129 26,385 25,061 $56,879 12.9% 11.5% 15.8% 18.9% 19.9% 13.3% 7.7% 36.7 6,486 7,432 6,919 6,132 11.9% 19.3% 16.7% 20.1% 23.8% 6.8% 1.1% 0.4% 3,004 3,292 3,145 2,866 $42,947 12.5% 10.0% 15.7% 21.7% 18.3% 13.3% 8.5% 36.7 117,923 118,905 119,150 116,664 15.5% 13.4% 11.5% 14.9% 18.0% 11.3% 10.5% 4.9% 52,558 50,925 52,402 52,748 $62,053 12.4% 11.6% 14.5% 18.5% 21.1% 13.8% 8.0% 38.4 Population ’10 Est. Population ‘90 Census Population ’00 Census Population ‘15 Proj. Population Household Income Dist. <$14,999 $15,000-$24,999 $25,000-$34,999 $35,000-$49,999 $50,000-$74,999 $75,000-$99,999 $100,000-$149,999 $150,000> Households 2010 Estimate 1990 Census 2000 Census 2015 Projected Average HH Income Age Distribution 0-9 10-19 20-29 30-44 45-59 60-74 75+ Median Age Population ’10 Est. Population ‘90 Census Population ’00 Census Population ‘15 Proj. Population Household Income Dist. <$14,999 $15,000-$24,999 $25,000-$34,999 $35,000-$49,999 $50,000-$74,999 $75,000-$99,999 $100,000-$149,999 $150,000> Households 2010 Estimate 1990 Census 2000 Census 2015 Projected Average HH Income Age Distribution 0-9 10-19 20-29 30-44 45-59 60-74 75+ Median Age Population ‘10 Est. Population ‘90 Census Population ’00 Census Population ‘15 Proj. Population Household Income Dist. <$14,999 $15,000-$24,999 $25,000-$34,999 $35,000-$49,999 $50,000-$74,999 $75,000-$99,999 $100,000-$149,999 $150,000> Households 2010 Estimate 1990 Census 2000 Census 2015 Projected Average HH Income Age Distribution 0-9 10-19 20-29 30-44 45-59 60-74 75+ Median Age N 1011 South Second Street Springfield, IL 62704 Ph. (217) 525-1173 Website: www.gscc.org City of Springfield, Illinois Office of Planning & Econ. Development 800 E. Monroe, Room 107 Springfield, IL 62701 Ph. (217) 789-2377 Website: www.springfield.il.us/oped A Guide to Retail: Park South Demographics: Park South Retail Center Park South – Once an industrial hub of Sangamon County, Park South is now one of the fastest growing retail/office areas in Springfield. Park South offers a mixture of fast food restaurants, small retail establishments, and office buildings.
Marketplace Profile N 1011 South Second Street Springfield, IL 62704 Ph. (217) 525-1173 Website: www.gscc.org City of Springfield, Illinois Office of Planning & Econ. Development 800 E. Monroe, Room 107 Springfield, IL 62701 Ph. (217) 789-2377 Website: www.springfield.il.us/oped A Guide to Retail: Park South County Market H&R Block Kennedy Kitchens Family Dollar Curves US Bank Shopping Center 17,300 AutoZone New China INB Bank F.B.I. Subway Family Video Burger King Cozy Dog Drive Inn 10,900 Walgreen’s Express Personnel HD Smith Marine Bank Regions Bank Thorton’s 3,850 Legend Retail Chain Restaurant Local Restaurant Convenience/Gas Lodging Grocery Local Retail/Service Banks Office Entertainment Available Sites Traffic Counts in Blue Mel-O-Cream Pizza Hut Jimmy Johns 33,800 KFC Taco Bell Starbuck’s CSC UCB Bank 24,300 Route 66 Hotel McDonald’s Arby’s
Location & Economies 1,676 1,156 1,636 1,766 5.3% 7.4% 7.8% 14.6% 20.9% 20.9% 13.0% 10.0% 748 508 723 798 $84,218 13.4% 10.3% 12.0% 19.3% 25.4% 14.3% 5.2% 39.9 25,386 18,013 23,268 26,289 8.3% 9.1% 9.1% 13.7% 19.5% 14.3% 17.3% 8.6% 11,255 7,510 10,220 11,715 $81,694 12.4% 11.0% 12.6% 18.6% 22.9% 14.7% 7.7% 40.7 86,968 76,031 83,677 89,522 10.8% 11.4% 10.3% 14.3% 19.9% 13.7% 13.2% 6.5% 38,859 33,182 37,207 39,999 $71,441 12.2% 11.5% 14.1% 19.3% 21.7% 13.2% 8.0% 38.8 Population ‘10 Est. Population ‘90 Census Population ’00 Census Population ‘15 Proj. Population Household Income Dist. <$14,999 $15,000-$24,999 $25,000-$34,999 $35,000-$49,999 $50,000-$74,999 $75,000-$99,999 $100,000-$149,999 $150,000> Households 2010 Estimate 1990 Census 2000 Census 2015 Projected Average HH Income Age Distribution 0-9 10-19 20-29 30-44 45-59 60-74 75+ Median Age Population ‘10 Est. Population ‘90 Census Population ’00 Census Population ‘15 Proj. Population Household Income Dist. <$14,999 $15,000-$24,999 $25,000-$34,999 $35,000-$49,999 $50,000-$74,999 $75,000-$99,999 $100,000-$149,999 $150,000> Households 2010 Estimate 1990 Census 2000 Census 2015 Projected Average HH Income Age Distribution 0-9 10-19 20-29 30-44 45-59 60-74 75+ Median Age Population ‘10 Est. Population ‘90 Census Population ’00 Census Population ‘15 Proj. Population Household Income Dist. <$14,999 $15,000-$24,999 $25,000-$34,999 $35,000-$49,999 $50,000-$74,999 $75,000-$99,999 $100,000-$149,999 $150,000> Households 2010 Estimate 1990 Census 2000 Census 2015 Projected Average HH Income Age Distribution 0-9 10-19 20-29 30-44 45-59 60-74 75+ Median Age N 1011 South Second Street Springfield, IL 62704 Ph. (217) 525-1173 Website: www.gscc.org City of Springfield, Illinois Office of Planning & Econ. Development 800 E. Monroe, Room 107 Springfield, IL 62701 Ph. (217) 789-2377 Website: www.springfield.il.us/oped A Guide to Retail: Prairie Crossing Demographics: Prairie Crossing 3 Miles 5 Miles 1 Mile Prairie Crossing – Anchored by Meijer Superstore in 2000, Prairie Crossing is now home to two major hotels (Hampton Inn & Suites and Staybridge Suites), multiple car dealers, several furniture outlets, four sit-down restaurants (Bob Evans, Steak-n-Shake, Monical’s, and O’Charley’s) and plans for a new Menard’s.
Marketplace Profile To I-72 Legend Retail Chain Restaurant Local Restaurant Convenience/Gas Lodging Grocery Local Retail/Service Banks Office Available Sites Entertainment Traffic Counts in Blue N 1011 South Second Street Springfield, IL 62704 Ph. (217) 525-1173 Website: www.gscc.org City of Springfield, Illinois Office of Planning & Econ. Development 800 E. Monroe, Room 107 Springfield, IL 62701 Ph. (217) 789-2377 Website: www.springfield.il.us/oped A Guide to Retail: Prairie Crossing 31,200 Homeway Homes The Organized Home Ashley Furniture Gander MTN Furniture Row Sofa Mart Denver Mattress Bedroom Expressions Oak Express Hampton Inn & Suites Menard’s Future Site Steak-n-Shake Staybridge Suites Bob Evan’s Meijer Superstore Tractor Supply Co. Car Dealerships O’Charley’s 8,300 Vision Care 2,900 27,600 Car Dealerships Car Dealerships Monical’s Pizza Starcrest Cleaners Xanadoo State Farm Shelter Insurance St. John’s Health Care
Location & Economies 4,948 3,849 4,675 5,163 5.2% 6.7% 6.3% 14.1% 22.3% 20.2% 18.5% 6.6% 2,160 1,536 2,012 2,278 $85,012 12.2% 10.7% 10.4% 19.1% 24.8% 15.9% 6.8% 42.1 28,014 33,273 34,803 34,781 7.9% 9.2% 9.1% 13.1% 18.5% 14.7% 18.1% 9.4% 15,262 11,198 14,260 15,546 $83,607 11.6% 10.6% 12.6% 18.0% 23.7% 15.0% 8.5% 41.6 84,835 90,993 91,910 91,403 12.5% 12.0% 10.8% 14.1% 19.0% 12.9% 12.4% 6.2% 40,792 36,371 39,743 41,162 $69,049 12.1% 11.4% 14.1% 19.1% 21.6% 13.3% 8.3% 38.9 Population ‘10 Est. Population ‘90 Census Population ’00 Census Population ‘15 Proj. Population Household Income Dist. <$14,999 $15,000-$24,999 $25,000-$34,999 $35,000-$49,999 $50,000-$74,999 $75,000-$99,999 $100,000-$149,999 $150,000> Households 2010 Estimate 1990 Census 2000 Census 2015 Projected Average HH Income Age Distribution 0-9 10-19 20-29 30-44 45-59 60-74 75+ Median Age Population ‘10 Est. Population ‘90 Census Population ’00 Census Population ‘15 Proj. Population Household Income Dist. <$14,999 $15,000-$24,999 $25,000-$34,999 $35,000-$49,999 $50,000-$74,999 $75,000-$99,999 $100,000-$149,999 $150,000> Households 2010 Estimate 1990 Census 2000 Census 2015 Projected Average HH Income Age Distribution 0-9 10-19 20-29 30-44 45-59 60-74 75+ Median Age Population ‘10 Est. Population ‘90 Census Population ’00 Census Population ‘15 Proj. Population Household Income Dist. <$14,999 $15,000-$24,999 $25,000-$34,999 $35,000-$49,999 $50,000-$74,999 $75,000-$99,999 $100,000-$149,999 $150,000> Households 2010 Estimate 1990 Census 2000 Census 2015 Projected Average HH Income Age Distribution 0-9 10-19 20-29 30-44 45-59 60-74 75+ Median Age N 1011 South Second Street Springfield, IL 62704 Ph. (217) 525-1173 Website: www.gscc.org City of Springfield, Illinois Office of Planning & Econ. Development 800 E. Monroe, Room 107 Springfield, IL 62701 Ph. (217) 789-2377 Website: www.springfield.il.us/oped A Guide to Retail: Parkway Pointe Demographics: Parkway Pointe 3 Miles 5 Miles 1 Mile Parkway Pointe – Wal-Mart and Target are the focus of this retail site but are complimented by Menard’s, Keresotes Theatres, and a host of chain hotels and restaurants. With easy access to I-72 and a close proximity to White Oaks Mall, Parkway Point attracts regional shoppers with its convenient location.
Marketplace Profile N 1011 South Second Street Springfield, IL 62704 Ph. (217) 525-1173 Website: www.gscc.org City of Springfield, Illinois Office of Planning & Econ. Development 800 E. Monroe, Room 107 Springfield, IL 62701 Ph. (217) 789-2377 Website: www.springfield.il.us/oped A Guide to Retail: Parkway Pointe 30,700 8,500 Menard’s Lebeda Mattress H&R Block Movie Theatre Dress Barn Sprint Store Pease’s Candy Nail Tech Game Stop Subway Cara Mongolian BBQ Family Christian Store Shoe Carnival AppleBee’s Sam’s Best Brands Huck’s 8,300 5,900 16,300 Golf Discount Walgreen’s Wal - Mart Starbuck’s 31,300 Legend Retail Chain Restaurant Local Restaurant Convenience/Gas Lodging Grocery Local Retail/Service Banks Office Entertainment Available Sites Traffic Counts in Blue McDonald’s 2,700 Insure One FedEx Office Verizon Perkin’s Target Baker’s Square Comfort Inn Fairfield Inn Courtyard by Marriot Carpet Weavers Friar Tuck’s Sleep Inn
Location & Economies 7,716 6,230 7,124 7,868 6.4% 6.5% 6.3% 12.0% 21.2% 18.2% 22.3% 7.1% 3,432 2,314 3,089 3,546 $86,423 10.2% 10.9% 7.6% 16.2% 25.0% 19.1% 11.0% 47.5 48,799 43,529 47,889 48,397 8.9% 10.4% 9.9% 14.3% 18.9% 14.1% 15.4% 8.0% 22,615 19,065 21,949 22,581 $77,580 11.3% 10.5% 13.5% 18.2% 22.6% 14.3% 9.6% 41.3 98,701 96,109 98,463 97,879 14.7% 12.8% 11.2% 14.2% 17.8% 11.9% 11.5% 5.9% 41,190 41,841 43,583 44,077 $65,738 12.5% 11.5% 12.2% 18.8% 21.1% 13.5% 8.4% 38.6 Population ‘10 Est. Population ‘90 Census Population ’00 Census Population ‘15 Proj. Population Household Income Dist. <$14,999 $15,000-$24,999 $25,000-$34,999 $35,000-$49,999 $50,000-$74,999 $75,000-$99,999 $100,000-$149,999 $150,000> Households 2010 Estimate 1990 Census 2000 Census 2015 Projected Average HH Income Age Distribution 0-9 10-19 20-29 30-44 45-59 60-74 75+ Median Age Population ‘10 Est. Population ‘90 Census Population ’00 Census Population ‘15 Proj. Population Household Income Dist. <$14,999 $15,000-$24,999 $25,000-$34,999 $35,000-$49,999 $50,000-$74,999 $75,000-$99,999 $100,000-$149,999 $150,000> Households 2010 Estimate 1990 Census 2000 Census 2015 Projected Average HH Income Age Distribution 0-9 10-19 20-29 30-44 45-59 60-74 75+ Median Age Population ‘10 Est. Population ‘90 Census Population ’00 Census Population ‘15 Proj. Population Household Income Dist. <$14,999 $15,000-$24,999 $25,000-$34,999 $35,000-$49,999 $50,000-$74,999 $75,000-$99,999 $100,000-$149,999 $150,000> Households 2010 Estimate 1990 Census 2000 Census 2015 Projected Average HH Income Age Distribution 0-9 10-19 20-29 30-44 45-59 60-74 75+ Median Age N 1011 South Second Street Springfield, IL 62704 Ph. (217) 525-1173 Website: www.gscc.org City of Springfield, Illinois Office of Planning & Econ. Development 800 E. Monroe, Room 107 Springfield, IL 62701 Ph. (217) 789-2377 Website: www.springfield.il.us/oped A Guide to Retail: White Oaks Mall Demographics: White Oaks Mall 3 Miles 5 Miles 1 Mile White Oaks Mall – White Oaks Mall is the largest enclosed shopping center in Central Illinois and is the hub of all retail activity for the area. Anchored by Bergner’s, Sears, Dick’s Sporting Goods and Macy’s, White Oaks has over one hundred stores with nearly one million square feet of retail space.
Marketplace Profile N 1011 South Second Street Springfield, IL 62704 Ph. (217) 525-1173 Website: www.gscc.org City of Springfield, Illinois Office of Planning & Econ. Development 800 E. Monroe, Room 107 Springfield, IL 62701 Ph. (217) 789-2377 Website: www.springfield.il.us/oped A Guide to Retail: White Oaks Mall The Gables “Upscale Retail” Talbots JoS A Banks Chicos Coldwater Creek Apricot Lane Tobin Jewlers TGI Friday’s 31,000 Sam’s Club Office Max Jimmy John’s 17,800 27,000 20,900 Sonic Burger King White Oaks MallBergner’s Macy’sSearsDick’s Pier 1 Discount Tire Co. White Oaks PlazaToys R Us Babies R Us Kohl’s CountyMarket TJ Max Buffet King Lens Crafters Petco Hallmark Fashion Bug Game Stop Ulta Beauty Bath & Body Works ApplianceWorld Chili’s Longhorn Steakhouse Denny’s 7,300 Legend Retail Chain Restaurant Local Restaurant Convenience/Gas Lodging Grocery Local Retail/Service Banks Office Entertainment Available Sites Traffic Counts in Blue Olive Garden 24,700 Gordon Food Services 23,900 Popeye’s Arby’s K Mart Staples Lowe's Barnes & Noble Michael’s Office Depot Panera Bread Mean’s Wearhouse Pets Mart Best Buy ShopKo 18,000 Pasta House Sports Authority Old Navy Bed, Bath & Beyond Gordmon’s David’s Bridal
Location & Economies 11,869 13,165 12,684 11,143 10.3% 13.7% 13.4% 15.7% 18.5% 12.9% 9.7% 5.8% 5,622 5,912 5,885 5,339 $66,640 12.6% 10.3% 14.8% 19.6% 21.0% 13.4% 8.1% 37.9 74,777 80,565 77,734 72,422 16.6% 14.1% 12.0% 14.7% 17.5% 10.7% 9.8% 4.5% 34,495 35,753 35,230 33,700 $59,888 12.1% 11.1% 15.1% 18.4% 20.4% 13.8% 9.1% 38.6 120,595 121,417 121,998 119,505 15.4% 13.3% 11.5% 15.0% 18.0% 11.4% 10.4% 5.0% 53,751 51,874 53,623 53,677 $62,175 12.5% 11.5% 14.5% 18.6% 21.1% 13.7% 8.2% 38.5 Population ‘10 Est. Population ‘90 Census Population ’00 Census Population ‘15 Proj. Population Household Income Dist. <$14,999 $15,000-$24,999 $25,000-$34,999 $35,000-$49,999 $50,000-$74,999 $75,000-$99,999 $100,000-$149,999 $150,000> Households 2010 Estimate 1990 Census 2000 Census 2015 Projected Average HH Income Age Distribution 0-9 10-19 20-29 30-44 45-59 60-74 75+ Median Age Population ‘10 Est. Population ‘90 Census Population ’00 Census Population ‘15 Proj. Population Household Income Dist. <$14,999 $15,000-$24,999 $25,000-$34,999 $35,000-$49,999 $50,000-$74,999 $75,000-$99,999 $100,000-$149,999 $150,000> Households 2010 Estimate 1990 Census 2000 Census 2015 Projected Average HH Income Age Distribution 0-9 10-19 20-29 30-44 45-59 60-74 75+ Median Age Population ‘10 Est. Population ‘90 Census Population ’00 Census Population ‘15 Proj. Population Household Income Dist. <$14,999 $15,000-$24,999 $25,000-$34,999 $35,000-$49,999 $50,000-$74,999 $75,000-$99,999 $100,000-$149,999 $150,000> Households 2010 Estimate 1990 Census 2000 Census 2015 Projected Average HH Income Age Distribution 0-9 10-19 20-29 30-44 45-59 60-74 75+ Median Age N 1011 South Second Street Springfield, IL 62704 Ph. (217) 525-1173 Website: www.gscc.org City of Springfield, Illinois Office of Planning & Econ. Development 800 E. Monroe, Room 107 Springfield, IL 62701 Ph. (217) 789-2377 Website: www.springfield.il.us/oped A Guide to Retail: MacArthur Blvd. Retail Strip Demographics: MacArthur Blvd. Retail Strip 3 Miles 5 Miles 1 Mile MacArthur Blvd. Retail Strip – One of the most established retail strips in the Springfield area, Macarthur Blvd has a wide variety of local shops and restaurants. Town and Country Shopping Plaza is the preeminent location for retailers along Macarthur and is home to Chuck-E-Cheese, Radio Shack, Burlington Coat Factory and a variety of other national and local shops.
Marketplace Profile Legend Retail Chain Restaurant Local Restaurant Convenience/Gas Lodging Grocery Local Retail/Service Banks Office Available Sites Entertainment Traffic Counts in Blue N 1011 South Second Street Springfield, IL 62704 Ph. (217) 525-1173 Website: www.gscc.org City of Springfield, Illinois Office of Planning & Econ. Development 800 E. Monroe, Room 107 Springfield, IL 62701 Ph. (217) 789-2377 Website: www.springfield.il.us/oped A Guide to Retail: MacArthur Blvd. Retail Strip Baskin Robin’s Elementary School WC Media A+ Pack & Ship Don Smith Paint Ross Isaacs Wild Birds Unlimited McDonald’s 6,100 Walgreen’s Auto Zone Vacat Former K-Mart Vacant 21,600 2,000 Proposed Retail Center National RTO BC/ BS Jiffy Lube Town & Country Shopping Plaza Chuck E Cheese Burlington Coat Factory Diamond’s Restaurant Super Dollar Tree Tuesday Morning Radio Shack Designer Chic Taste of Thai Xtreme Dublin’s Pub Hair Cuttery Schramm-BacherJewlers CVS Vacant Rent-A-Center Napa Auto Parts Goodyear Ace Bike Shop 2,850 Advance Auto Parts Firestone Fritz’s Ayerco Subway The Gyro Stop Antonio’s Pizza 28,900 Show-Me’s
Location & Economies 3,045 516 2,010 3,643 3.5% 3.8% 4.3% 8.7% 19.7% 18.1% 31.2% 10.7% 1,251 220 822 1,510 $107,470 16.2% 11.3% 11.6% 24.0% 22.4% 9.0% 5.4% 35.5 27,821 19,413 25,040 28,705 6.5% 7.9% 7.2% 12.7% 18.7% 15.9% 19.9% 11.2% 12,316 7,962 11,002 12,781 $89,332 11.5% 11.0% 11.6% 17.7% 24.4% 14.9% 9.0% 42.6 74,927 66,278 72,640 75,276 10.1% 11.5% 10.6% 14.4% 19.1% 13.4% 13.6% 7.3% 34,163 29,506 32,927 34,468 $73,737 11.9% 11.1% 13.7% 19.1% 22.3% 13.5% 8.5% 39.8 Population ‘10 Est. Population ‘90 Census Population ’00 Census Population ‘15 Proj. Population Household Income Dist. <$14,999 $15,000-$24,999 $25,000-$34,999 $35,000-$49,999 $50,000-$74,999 $75,000-$99,999 $100,000-$149,999 $150,000> Households 2010 Estimate 1990 Census 2000 Census 2015 Projected Average HH Income Age Distribution 0-9 10-19 20-29 30-44 45-59 60-74 75+ Median Age Population ‘10 Est. Population ‘90 Census Population ’00 Census Population ‘15 Proj. Population Household Income Dist. <$14,999 $15,000-$24,999 $25,000-$34,999 $35,000-$49,999 $50,000-$74,999 $75,000-$99,999 $100,000-$149,999 $150,000> Households 2010 Estimate 1990 Census 2000 Census 2015 Projected Average HH Income Age Distribution 0-9 10-19 20-29 30-44 45-59 60-74 75+ Median Age Population ‘10 Est. Population ‘90 Census Population ’00 Census Population ‘15 Proj. Population Household Income Dist. <$14,999 $15,000-$24,999 $25,000-$34,999 $35,000-$49,999 $50,000-$74,999 $75,000-$99,999 $100,000-$149,999 $150,000> Households 2010 Estimate 1990 Census 2000 Census 2015 Projected Average HH Income Age Distribution 0-9 10-19 20-29 30-44 45-59 60-74 75+ Median Age N 1011 South Second Street Springfield, IL 62704 Ph. (217) 525-1173 Website: www.gscc.org City of Springfield, Illinois Office of Planning & Econ. Development 800 E. Monroe, Room 107 Springfield, IL 62701 Ph. (217) 789-2377 Website: www.springfield.il.us/oped A Guide to Retail: West Wabash Demographics: West Wabash 3 Miles 5 Miles 1 Mile West Wabash – Wells Fargo and Cingular are located just east of I-72, and retail expansion is quickly growing out to meet them. In addition to a host of new car dealerships in the area, a twelve screen theatre and a high-end retail plaza have moved onto West Wabash Avenue.
Marketplace Profile Legend Retail Chain Restaurant Local Restaurant Convenience/Gas Lodging Grocery Local Retail/Service Banks Office Available Sites Entertainment Traffic Counts in Blue N 1011 South Second Street Springfield, IL 62704 Ph. (217) 525-1173 Website: www.gscc.org City of Springfield, Illinois Office of Planning & Econ. Development 800 E. Monroe, Room 107 Springfield, IL 62701 Ph. (217) 789-2377 Website: www.springfield.il.us/oped A Guide to Retail: West Wabash 7,700 Yellowstone Upscale Retail Shops La-Z Boy 4,300 Car Dealerships Illinois Plumbing Car Dealership 13,100 Former Leath Furniture Qik n EZ 12,200 14,300 Arizona Tile Culver’s Capitol Group Buffalo Wild Wings 11,300 Wells Fargo Home Mortgage Movie Theatre Cingular Wireless Call Center 15,700
Location & Economies 9,027 8,803 9,298 8,663 13.0% 14.8% 12.1% 17.8% 17.5% 10.6% 10.3% 3.9% 4,346 3,938 4,373 4,223 $60,154 12.0% 9.6% 17.6% 17.3% 19.4% 15.1% 9.0% 39.3 62,759 62,809 64,268 61,373 12.9% 13.1% 11.5% 15.0% 18.5% 11.7% 11.9% 5.4% 29,469 28,374 29,737 29,056 $66,185 11.8% 10.7% 15.0% 18.8% 21.3% 13.7% 8.9% 39.2 113,208 112,100 113,684 113,315 15.4% 13.1% 11.4% 14.5% 17.7% 11.6% 10.9% 5.4% 50,470 48,308 50,068 50,824 $63,709 12.5% 11.5% 14.5% 18.6% 21.0% 13.6% 8.3% 38.4 Population ‘10 Est. Population ‘90 Census Population ’00 Census Population ‘15 Proj. Population Household Income Dist. <$14,999 $15,000-$24,999 $25,000-$34,999 $35,000-$49,999 $50,000-$74,999 $75,000-$99,999 $100,000-$149,999 $150,000> Households 2010 Estimate 1990 Census 2000 Census 2015 Projected Average HH Income Age Distribution 0-9 10-19 20-29 30-44 45-59 60-74 75+ Median Age Population ‘10 Est. Population ‘90 Census Population ’00 Census Population ‘15 Proj. Population Household Income Dist. <$14,999 $15,000-$24,999 $25,000-$34,999 $35,000-$49,999 $50,000-$74,999 $75,000-$99,999 $100,000-$149,999 $150,000> Households 2010 Estimate 1990 Census 2000 Census 2015 Projected Average HH Income Age Distribution 0-9 10-19 20-29 30-44 45-59 60-74 75+ Median Age Population ‘10 Est. Population ‘90 Census Population ’00 Census Population ‘15 Proj. Population Household Income Dist. <$14,999 $15,000-$24,999 $25,000-$34,999 $35,000-$49,999 $50,000-$74,999 $75,000-$99,999 $100,000-$149,999 $150,000> Households 2010 Estimate 1990 Census 2000 Census 2015 Projected Average HH Income Age Distribution 0-9 10-19 20-29 30-44 45-59 60-74 75+ Median Age N 1011 South Second Street Springfield, IL 62704 Ph. (217) 525-1173 Website: www.gscc.org City of Springfield, Illinois Office of Planning & Econ. Development 800 E. Monroe, Room 107 Springfield, IL 62701 Ph. (217) 789-2377 Website: www.springfield.il.us/oped A Guide to Retail: Chatham Square & Montvale Demographics: Chatham Sq. & Montvale 3 Miles 5 Miles 1 Mile Chatham Square/Montvale – Situated along major N/S and E/W thoroughfares, the corner of Chatham Road and Wabash Avenue has among the highest traffic counts in the city. With two large grocery stores, numerous restaurants, banking and local and national retailers, the Wabash corridor continues to invite customers and businesses alike.
Marketplace Profile Legend Retail Chain Restaurant Local Restaurant Convenience/Gas Lodging Grocery Local Retail/Service Banks Office Available Sites Entertainment Traffic Counts in Blue N 1011 South Second Street Springfield, IL 62704 Ph. (217) 525-1173 Website: www.gscc.org City of Springfield, Illinois Office of Planning & Econ. Development 800 E. Monroe, Room 107 Springfield, IL 62701 Ph. (217) 789-2377 Website: www.springfield.il.us/oped A Guide to Retail: Chatham Square & Montvale 2,850 Montvale Plaza Shoetopia Little Ceasar’s Great Harvets Bread The Office Bar & Grill Great Harvest Bread AAA Travel Great Clips Sunny China MySub Montvale Plaza Pizza Hut Citi Financial Edward Jones The Corkscrew Pap Murphy’s Pizza Beltone 12,100 UCB Bank 19,000 Schnuck’s West Grand Plaza Capital City Games Aerus Electrolux Sue Thompson Gallery Medlab Carens Paw Parlor Green Apple Photo Nanncy’sKnitworkds It’s All About Wine Spaghetti Shop AZTCA Mexican Grill Custom Cuts Nails Plus Security Bank Little Saigon Hobby Lobby Benchmark Auto Sound PNC Bank Wabash Golf n Games Lauterbach Tire Goodwill Brahle’rs The Barrelhead McDonald’s Shop n Save Wabash Square 29,200 24,700 Hardees Sonic Steak n Shake Godfathers Pizza Flooring Depot Devine Design Papa John’s Gateway to India 17,400 The Yard Ace Hardware Jeffrey Allens Dollar General Pella Window & Doors Jackson Hewitt Taxes L1 Identity Srvs MERCY House Henry’s Appliance Wabash Center Food Fantasies A1 Travel Advance America Q Nails & Spa Liberty Tax Chatham Square New Buffet City Capital Teletrack Aldi’s Salvation Army USPS Amber Jack’s Ale House
Location & Economies 11,471 12,112 12,052 10,870 12.7% 14.4% 13.5% 17.3% 18.0% 11.6% 9.5% 3.0% 5,766 5,822 5,951 5,507 $59,844 9.9% 9.2% 16.7% 17.4% 19.8% 14.1% 12.9% 41.5 68,669 73,597 71,053 66,456 16.0% 13.3% 11.8% 14.4% 16.5% 11.2% 11.3% 5.5% 32,013 33,021 32,599 31,260 $63,702 11.4% 11.1% 14.8% 18.1% 21.2% 13.8% 9.6% 39.6 116,125 119,695 118,238 114,406 15.7% 13.8% 11.6% 15.3% 18.0% 11.0% 9.9% 4.7% 51,994 51,288 52,133 51,665 $60,472 12.6% 11.5% 14.2% 18.7% 20.9% 13.8% 8.4% 38.5 Population ‘10 Est. Population ‘90 Census Population ’00 Census Population ‘15 Proj. Population Household Income Dist. <$14,999 $15,000-$24,999 $25,000-$34,999 $35,000-$49,999 $50,000-$74,999 $75,000-$99,999 $100,000-$149,999 $150,000> Households 2010 Estimate 1990 Census 2000 Census 2015 Projected Average HH Income Age Distribution 0-9 10-19 20-29 30-44 45-59 60-74 75+ Median Age Population ‘10 Est. Population ‘90 Census Population ’00 Census Population ‘15 Proj. Population Household Income Dist. <$14,999 $15,000-$24,999 $25,000-$34,999 $35,000-$49,999 $50,000-$74,999 $75,000-$99,999 $100,000-$149,999 $150,000> Households 2010 Estimate 1990 Census 2000 Census 2015 Projected Average HH Income Age Distribution 0-9 10-19 20-29 30-44 45-59 60-74 75+ Median Age Population ‘10 Est. Population ‘90 Census Population ’00 Census Population ‘15 Proj. Population Household Income Dist. <$14,999 $15,000-$24,999 $25,000-$34,999 $35,000-$49,999 $50,000-$74,999 $75,000-$99,999 $100,000-$149,999 $150,000> Households 2010 Estimate 1990 Census 2000 Census 2015 Projected Average HH Income Age Distribution 0-9 10-19 20-29 30-44 45-59 60-74 75+ Median Age N 1011 South Second Street Springfield, IL 62704 Ph. (217) 525-1173 Website: www.gscc.org City of Springfield, Illinois Office of Planning & Econ. Development 800 E. Monroe, Room 107 Springfield, IL 62701 Ph. (217) 789-2377 Website: www.springfield.il.us/oped A Guide to Retail: Fairhills Shopping Center Demographics: Fairhills Shopping Center 3 Miles 5 Miles 1 Mile Fairhills Shopping Center – One of the most established retail hubs in Springfield, Fairhills Shopping Center is anchored by the recently renovated County Market. Local retailers, service providers and convenience shopping make Fairhills a frequent destination for area residents and out of town shoppers.
Marketplace Profile Legend Retail Chain Restaurant Local Restaurant Convenience/Gas Lodging Grocery Local Retail/Service Banks Office Available Sites Entertainment Traffic Counts in Blue N 1011 South Second Street Springfield, IL 62704 Ph. (217) 525-1173 Website: www.gscc.org City of Springfield, Illinois Office of Planning & Econ. Development 800 E. Monroe, Room 107 Springfield, IL 62701 Ph. (217) 789-2377 Website: www.springfield.il.us/oped A Guide to Retail: Fairhills Shopping Center Fairhills Shopping Center Baskin Robbins Mel O Cream Donuts Family Dollar Family Pride Laundry Home Décor & More. Dean Carver’s. Arby’s Hallmark Sundown Tan Curve’s China Wok 16,000 CVS 9,900 12,800 Sports Care 16,100 Illini Bank County Market Qik n EZ Starbuck’s 9,100 Shell Gas Springfield School District 186 District Office 14,800
Location & Economies 11,471 12,112 12,052 10,870 12.7% 14.4% 13.5% 17.3% 18.0% 11.6% 9.5% 3.0% 5,766 5,822 5,951 5,507 $59,844 9.9% 9.2% 16.7% 17.4% 19.8% 14.1% 12.9% 41.5 68,669 73,597 71,053 66,456 16.0% 13.3% 11.8% 14.4% 16.5% 11.2% 11.3% 5.5% 32,013 33,021 32,599 31,260 $63,702 11.4% 11.1% 14.8% 18.1% 21.2% 13.8% 9.6% 39.6 116,125 119,695 118,238 114,406 15.7% 13.8% 11.6% 15.3% 18.0% 11.0% 9.9% 4.7% 51,994 51,288 52,133 51,665 $60,472 12.6% 11.5% 14.2% 18.7% 20.9% 13.8% 8.4% 38.5 Population ‘10 Est. Population ‘90 Census Population ’00 Census Population ‘15 Proj. Population Household Income Dist. <$14,999 $15,000-$24,999 $25,000-$34,999 $35,000-$49,999 $50,000-$74,999 $75,000-$99,999 $100,000-$149,999 $150,000> Households 2010 Estimate 1990 Census 2000 Census 2015 Projected Average HH Income Age Distribution 0-9 10-19 20-29 30-44 45-59 60-74 75+ Median Age Population ‘10 Est. Population ‘90 Census Population ’00 Census Population ‘15 Proj. Population Household Income Dist. <$14,999 $15,000-$24,999 $25,000-$34,999 $35,000-$49,999 $50,000-$74,999 $75,000-$99,999 $100,000-$149,999 $150,000> Households 2010 Estimate 1990 Census 2000 Census 2015 Projected Average HH Income Age Distribution 0-9 10-19 20-29 30-44 45-59 60-74 75+ Median Age Population ‘10 Est. Population ‘90 Census Population ’00 Census Population ‘15 Proj. Population Household Income Dist. <$14,999 $15,000-$24,999 $25,000-$34,999 $35,000-$49,999 $50,000-$74,999 $75,000-$99,999 $100,000-$149,999 $150,000> Households 2010 Estimate 1990 Census 2000 Census 2015 Projected Average HH Income Age Distribution 0-9 10-19 20-29 30-44 45-59 60-74 75+ Median Age N 1011 South Second Street Springfield, IL 62704 Ph. (217) 525-1173 Website: www.gscc.org City of Springfield, Illinois Office of Planning & Econ. Development 800 E. Monroe, Room 107 Springfield, IL 62701 Ph. (217) 789-2377 Website: www.springfield.il.us/oped A Guide to Retail: Downtown Springfield Demographics: Downtown Springfield 3 Miles 5 Miles 1 Mile Fairhills Shopping Center – One of the most established retail hubs in Springfield, Fairhills Shopping Center is anchored by the recently renovated County Market. Local retailers, service providers and convenience shopping make Fairhills a frequent destination for area residents and out of town shoppers.
Marketplace Profile Legend Retail Chain Restaurant Local Restaurant Convenience/Gas Lodging Grocery Local Retail/Service Banks Office Available Sites Entertainment Traffic Counts in Blue N 1011 South Second Street Springfield, IL 62704 Ph. (217) 525-1173 Website: www.gscc.org City of Springfield, Illinois Office of Planning & Econ. Development 800 E. Monroe, Room 107 Springfield, IL 62701 Ph. (217) 789-2377 Website: www.springfield.il.us/oped A Guide to Retail: Downtown Springfield Fairhills Shopping Center Baskin Robbins Mel O Cream Donuts Family Dollar Family Pride Laundry Home Décor & More. Dean Carver’s. Arby’s Hallmark Sundown Tan Curve’s China Wok 16,000 CVS 9,900 12,800 Sports Care 16,100 Illini Bank County Market Qik n EZ Starbuck’s 9,100 Shell Gas Springfield School District 186 District Office 14,800
Location & Economies 2,988 1,791 2,375 3,389 7.2% 7.0% 6.2% 13.6% 28.2% 20.4% 12.3% 5.1% 1,127 617 883 1,286 $73,548 14.3% 16.7% 10.3% 22.9% 21.0% 10.1% 4.7% 35.3 13,045 6,726 9,973 15,575 5.3% 4.2% 5.4% 10.7% 26.3% 20.4% 18.4% 9.4% 4,788 2,293 3,591 5,777 $87,492 15.1% 16.4% 9.2% 22.8% 22.8% 10.5% 3.5% 35.9 23,685 12,867 19,335 29,281 5.4% 5.1% 7.1% 11.5% 24.0% 18.7% 18.8% 9.4% 9,148 4,620 7,456 11,311 $86,927 14.2% 14.7% 10.6% 21.7% 23.6% 11.4% 3.8% 36.8 Population ‘10 Est. Population ‘90 Census Population ’00 Census Population ‘15 Proj. Population Household Income Dist. <$14,999 $15,000-$24,999 $25,000-$34,999 $35,000-$49,999 $50,000-$74,999 $75,000-$99,999 $100,000-$149,999 $150,000> Households 2010 Estimate 1990 Census 2000 Census 2015 Projected Average HH Income Age Distribution 0-9 10-19 20-29 30-44 45-59 60-74 75+ Median Age Population ‘10 Est. Population ‘90 Census Population ’00 Census Population ‘15 Proj. Population Household Income Dist. <$14,999 $15,000-$24,999 $25,000-$34,999 $35,000-$49,999 $50,000-$74,999 $75,000-$99,999 $100,000-$149,999 $150,000> Households 2010 Estimate 1990 Census 2000 Census 2015 Projected Average HH Income Age Distribution 0-9 10-19 20-29 30-44 45-59 60-74 75+ Median Age Population ‘10 Est. Population ‘90 Census Population ’00 Census Population ‘15 Proj. Population Household Income Dist. <$14,999 $15,000-$24,999 $25,000-$34,999 $35,000-$49,999 $50,000-$74,999 $75,000-$99,999 $100,000-$149,999 $150,000> Households 2010 Estimate 1990 Census 2000 Census 2015 Projected Average HH Income Age Distribution 0-9 10-19 20-29 30-44 45-59 60-74 75+ Median Age N 1011 South Second Street Springfield, IL 62704 Ph. (217) 525-1173 Website: www.gscc.org City of Springfield, Illinois Office of Planning & Econ. Development 800 E. Monroe, Room 107 Springfield, IL 62701 Ph. (217) 789-2377 Website: www.springfield.il.us/oped A Guide to Retail: Main Street Chatham Demographics: Main Street Chatham 3 Miles 5 Miles 1 Mile Main Street Chatham – Spurred by the rapid population growth in the community, Route 4 has become a destination for a number of national and local restaurants and retailers. Ace Hardware, Walgreens and County Market are all new major retailers taking advantage of Chatham’s growth.
Marketplace Profile Legend Retail Chain Restaurant Local Restaurant Convenience/Gas Lodging Grocery Local Retail/Service Banks Office Available Sites Entertainment Traffic Counts in Blue N 1011 South Second Street Springfield, IL 62704 Ph. (217) 525-1173 Website: www.gscc.org City of Springfield, Illinois Office of Planning & Econ. Development 800 E. Monroe, Room 107 Springfield, IL 62701 Ph. (217) 789-2377 Website: www.springfield.il.us/oped A Guide to Retail: Main Street Chatham Ace Hardware Casey’s One Stop Auto Dollar General Mobile Super Pantry 2,450 Foxx Creek Plaza County Market Antonio’s Pizza The Creek Pub & Grill Curve’s Computer Works Chatham Home Svs State Farm Insurance Snap Fitness Kaleidoscoops Ice Cream Advance Physical Therapy Koke’sKidzone Sun Room Tanning CT Nails Bank of Springfield 18,100 Walgreen’s 16,100 Godfathers Pizza Checkpoint Tire & Auto Shell Gas Goodwill China River Restaurant Vito’s Italian Restaurant Sullivan Financial Little Italy’s Edward Jones The Alamo BL’s Tonsorial Parlor Coonrod Financial Nam’s Alterations DBS Horace Mann Insurance Hardees McDonald’s Secret Recipes Chatham Collision Repair Subway Casey’s General Store BP Gas UCB Bank 9,200 3,450 Chatham Plaza Family Video
Location & Economies 1,108 696 864 1,183 2.1% 2.7% 5.2% 9.9% 23.7% 28.4% 23.6% 4.3% 387 235 296 417 $93,767 13.0% 14.3% 8.6% 19.3% 24.4% 9.8% 10.5% 40.2 7,243 5,222 6,196 7,649 5.2% 8.5% 8.4% 13.0% 23.5% 20.3% 17.5% 3.7% 2,724 1,909 2,308 2,905 $76,156 12.8% 13.2% 9.8% 19.6% 24.2% 11.8% 8.5% 40.0 24,543 20,924 22,933 24,572 7.4% 10.4% 9.9% 16.7% 24.9% 15.6% 11.8% 3.4% 9,727 7,624 8,950 9,827 $64,297 13.1% 12.8% 11.2% 19.8% 23.2% 13.3% 6.5% 38.9 Population ‘10 Est. Population ‘90 Census Population ’00 Census Population ‘15 Proj. Population Household Income Dist. <$14,999 $15,000-$24,999 $25,000-$34,999 $35,000-$49,999 $50,000-$74,999 $75,000-$99,999 $100,000-$149,999 $150,000> Households 2010 Estimate 1990 Census 2000 Census 2015 Projected Average HH Income Age Distribution 0-9 10-19 20-29 30-44 45-59 60-74 75+ Median Age Population ‘10 Est. Population ‘90 Census Population ’00 Census Population ‘15 Proj. Population Household Income Dist. <$14,999 $15,000-$24,999 $25,000-$34,999 $35,000-$49,999 $50,000-$74,999 $75,000-$99,999 $100,000-$149,999 $150,000> Households 2010 Estimate 1990 Census 2000 Census 2015 Projected Average HH Income Age Distribution 0-9 10-19 20-29 30-44 45-59 60-74 75+ Median Age Population ‘10 Est. Population ‘90 Census Population ’00 Census Population ‘15 Proj. Population Household Income Dist. <$14,999 $15,000-$24,999 $25,000-$34,999 $35,000-$49,999 $50,000-$74,999 $75,000-$99,999 $100,000-$149,999 $150,000> Households 2010 Estimate 1990 Census 2000 Census 2015 Projected Average HH Income Age Distribution 0-9 10-19 20-29 30-44 45-59 60-74 75+ Median Age N 1011 South Second Street Springfield, IL 62704 Ph. (217) 525-1173 Website: www.gscc.org City of Springfield, Illinois Office of Planning & Econ. Development 800 E. Monroe, Room 107 Springfield, IL 62701 Ph. (217) 789-2377 Website: www.springfield.il.us/oped A Guide to Retail: Downtown Sherman Demographics: Downtown Sherman 3 Miles 5 Miles 1 Mile Downtown Sherman – Located just off Interstate 55, Sherman has convenient access to travelers and offers the northernmost entrance to Springfield. In addition to high traffic counts, Sherman boasts a variety of local and chain dining establishments and quaint shopping experiences for local and out of town shoppers.
Marketplace Profile Legend Retail Chain Restaurant Local Restaurant Convenience/Gas Lodging Grocery Local Retail/Service Banks Office Available Sites Entertainment Traffic Counts in Blue N 1011 South Second Street Springfield, IL 62704 Ph. (217) 525-1173 Website: www.gscc.org City of Springfield, Illinois Office of Planning & Econ. Development 800 E. Monroe, Room 107 Springfield, IL 62701 Ph. (217) 789-2377 Website: www.springfield.il.us/oped A Guide to Retail: Downtown Sherman 1 Stop Auto Seaney Farms 4,750 3,700 The Village Shoppes The Clothig Rack Just Kids Family Video Casey’s General Store Dairy Queen Larson Plaza Sams’s Too Pizza Country Financial Farmland Solutions 10,000 32,300 Curve’s for Women Ricco’s Pizza Edward Jones Cancun Restaurant Sherman Chiropractic Beekman Pharmacy Subway Village Hall Sherman Family Practice Clinic 10,900 Villa Health Center Ray’s Rt. 66 Diner
Development Profiles 1011 South Second Street Springfield, IL 62704 Ph. (217) 525-1173 Website: www.gscc.org City of Springfield, Illinois Office of Planning & Econ. Development 800 E. Monroe, Room 107 Springfield, IL 62701 Ph. (217) 789-2377 Website: www.springfield.il.us/oped A Guide to Retail: Retail Development Sites • Retail Development Sites: • Legacy Pointe • Jefferson Crossing • Lincolnwood Development • Iles Junction
Location & Economies 9,301 9,646 9,908 8,754 13.5% 17.0% 14.8% 18.4% 17.6% 9.2% 6.6% 2.8% 4,567 4,522 4,763 4,347 $53,060 13.0% 9.4% 19.9% 19.1% 18.0% 12.8% 7.6% 35.4 65,993 69,476 68,924 64,110 15.1% 13.9% 11.8% 14.9% 18.3% 11.2% 10.4% 4.5% 30,619 31,053 31,419 29,999 $61,593 12.0% 10.9% 15.1% 18.7% 20.6% 13.8% 8.9% 38.7 117,446 117,292 118,242 117,284 15.4% 13.3% 11.4% 14.8% 17.8% 11.5% 10.7% 5.2% 52,366 50,375 52,051 52,627 $62,934 12.5% 11.5% 14.5% 18.6% 21.0% 13.7% 8.2% 38.4 Population ‘10 Est. Population ‘90 Census Population ’00 Census Population ‘15 Proj. Population Household Income Dist. <$14,999 $15,000-$24,999 $25,000-$34,999 $35,000-$49,999 $50,000-$74,999 $75,000-$99,999 $100,000-$149,999 $150,000> Households 2010 Estimate 1990 Census 2000 Census 2015 Projected Average HH Income Age Distribution 0-9 10-19 20-29 30-44 45-59 60-74 75+ Median Age Population ‘10 Est. Population ‘90 Census Population ’00 Census Population ‘15 Proj. Population Household Income Dist. <$14,999 $15,000-$24,999 $25,000-$34,999 $35,000-$49,999 $50,000-$74,999 $75,000-$99,999 $100,000-$149,999 $150,000> Households 2010 Estimate 1990 Census 2000 Census 2015 Projected Average HH Income Age Distribution 0-9 10-19 20-29 30-44 45-59 60-74 75+ Median Age Population ‘10 Est. Population ‘90 Census Population ’00 Census Population ‘15 Proj. Population Household Income Dist. <$14,999 $15,000-$24,999 $25,000-$34,999 $35,000-$49,999 $50,000-$74,999 $75,000-$99,999 $100,000-$149,999 $150,000> Households 2010 Estimate 1990 Census 2000 Census 2015 Projected Average HH Income Age Distribution 0-9 10-19 20-29 30-44 45-59 60-74 75+ Median Age N 1011 South Second Street Springfield, IL 62704 Ph. (217) 525-1173 Website: www.gscc.org City of Springfield, Illinois Office of Planning & Econ. Development 800 E. Monroe, Room 107 Springfield, IL 62701 Ph. (217) 789-2377 Website: www.springfield.il.us/oped A Guide to Retail: Legacy Pointe Demographics: Legacy Pointe 3 Miles 5 Miles 1 Mile Legacy Pointe – Springfield’s newest development site sits on the western boundary of the recently completed MacArthur Boulevard, which connects the Wabash/MacArthur/Stanford intersection with I-72. Scheels, a sporting good superstore, will open in the summer of 2011 and anchor the region’s first lifestyle center.
Marketplace Profile N 1011 South Second Street Springfield, IL 62704 Ph. (217) 525-1173 Website: www.gscc.org City of Springfield, Illinois Office of Planning & Econ. Development 800 E. Monroe, Room 107 Springfield, IL 62701 Ph. (217) 789-2377 Website: www.springfield.il.us/oped A Guide to Retail: Legacy Pointe 24,600 24,700 29,200 17,400 Scheels Car Dealership Legend 8,900 31,200 31,200
Location & Economies 3,818 3,551 3,801 3,742 8.1% 10.9% 11.5% 16.9% 17.6% 14.9% 12.9% 7.3% 1,693 1,506 1,653 1,677 $79,072 11.5% 11.3% 12.0% 15.8% 25.1% 16.1% 7.1% 42.9 39,242 40,777 40,426 38,334 12.1% 12.0% 11.2% 14.2% 16.6% 12.4% 13.9% 7.5% 18,152 18,075 18,487 17,869 $72,154 10.8% 11.0% 13.9% 17.7% 22.6% 13.9% 10.1% 41.2 101,413 105,245 103,343 99,865 15.5% 13.5% 11.4% 15.0% 17.6% 11.2% 10.7% 5.1% 45,684 45,319 45,853 45,388 $62,058 12.4% 11.5% 14.2% 18.6% 21.1% 13.8% 8.6% 38.8 Population ‘10 Est. Population ‘90 Census Population ’00 Census Population ‘15 Proj. Population Household Income Dist. <$14,999 $15,000-$24,999 $25,000-$34,999 $35,000-$49,999 $50,000-$74,999 $75,000-$99,999 $100,000-$149,999 $150,000> Households 2010 Estimate 1990 Census 2000 Census 2015 Projected Average HH Income Age Distribution 0-9 10-19 20-29 30-44 45-59 60-74 75+ Median Age Population ‘10 Est. Population ‘90 Census Population ’00 Census Population ‘15 Proj. Population Household Income Dist. <$14,999 $15,000-$24,999 $25,000-$34,999 $35,000-$49,999 $50,000-$74,999 $75,000-$99,999 $100,000-$149,999 $150,000> Households 2010 Estimate 1990 Census 2000 Census 2015 Projected Average HH Income Age Distribution 0-9 10-19 20-29 30-44 45-59 60-74 75+ Median Age Population ‘10 Est. Population ‘90 Census Population ’00 Census Population ‘15 Proj. Population Household Income Dist. <$14,999 $15,000-$24,999 $25,000-$34,999 $35,000-$49,999 $50,000-$74,999 $75,000-$99,999 $100,000-$149,999 $150,000> Households 2010 Estimate 1990 Census 2000 Census 2015 Projected Average HH Income Age Distribution 0-9 10-19 20-29 30-44 45-59 60-74 75+ Median Age N 1011 South Second Street Springfield, IL 62704 Ph. (217) 525-1173 Website: www.gscc.org City of Springfield, Illinois Office of Planning & Econ. Development 800 E. Monroe, Room 107 Springfield, IL 62701 Ph. (217) 789-2377 Website: www.springfield.il.us/oped A Guide to Retail: Jefferson Crossing Demographics: Jefferson Crossing 3 Miles 5 Miles 1 Mile Jefferson Crossing – This proposed development sits on the city’s northwest corner where Illinois Route 4 and 97 connect. This site has forty-two acres of available space, ideal for a retail strip center. A TIF district has recently been approved for this development.
Marketplace Profile N 1011 South Second Street Springfield, IL 62704 Ph. (217) 525-1173 Website: www.gscc.org City of Springfield, Illinois Office of Planning & Econ. Development 800 E. Monroe, Room 107 Springfield, IL 62701 Ph. (217) 789-2377 Website: www.springfield.il.us/oped A Guide to Retail: Jefferson Crossing 15,600 6,600 Yellowstone Upscale Retail Shops 3,700 Illinois Plumbing Car Dealerships Car Dealership 11,000 10,700 11,100 11,600 Culver’s 10,000 Wells Fargo Home Mortgage Legend Movie Theatre Cingular Wireless Call Center 13,100 Flowers w/ Love A New You 16,700 14,400 23,200
Location & Economies 3,647 4,250 3,864 3,436 13.4% 16.8% 16.1% 18.1% 25.1% 7.2% 3.0% 0.2% 1,684 1,860 1,751 1,603 $44,073 11.6% 9.6% 14.7% 20.6% 18.0% 14.7% 10.8% 39.7 49,972 52,728 52,279 48,523 15.0% 14.0% 12.5% 15.7% 19.4% 11.0% 8.7% 3.7% 22,465 22,755 23,060 22,033 $58,651 12.9% 11.4% 16.0% 19.1% 19.9% 13.3% 7.5% 36.6 111,524 110,312 111,408 112,553 15.6% 13.1% 11.2% 14.4% 17.8% 11.7% 11.0% 5.2% 49,606 47,439 48,987 50,285 $63,581 12.4% 11.7% 14.5% 18.7% 21.1% 13.6% 8.0% 38.3 Population ‘10 Est. Population ‘90 Census Population ’00 Census Population ‘15 Proj. Population Household Income Dist. <$14,999 $15,000-$24,999 $25,000-$34,999 $35,000-$49,999 $50,000-$74,999 $75,000-$99,999 $100,000-$149,999 $150,000> Households 2010 Estimate 1990 Census 2000 Census 2015 Projected Average HH Income Age Distribution 0-9 10-19 20-29 30-44 45-59 60-74 75+ Median Age Population ‘10 Est. Population ‘90 Census Population ’00 Census Population ‘15 Proj. Population Household Income Dist. <$14,999 $15,000-$24,999 $25,000-$34,999 $35,000-$49,999 $50,000-$74,999 $75,000-$99,999 $100,000-$149,999 $150,000> Households 2010 Estimate 1990 Census 2000 Census 2015 Projected Average HH Income Age Distribution 0-9 10-19 20-29 30-44 45-59 60-74 75+ Median Age Population ‘10 Est. Population ‘90 Census Population ’00 Census Population ‘15 Proj. Population Household Income Dist. <$14,999 $15,000-$24,999 $25,000-$34,999 $35,000-$49,999 $50,000-$74,999 $75,000-$99,999 $100,000-$149,999 $150,000> Households 2010 Estimate 1990 Census 2000 Census 2015 Projected Average HH Income Age Distribution 0-9 10-19 20-29 30-44 45-59 60-74 75+ Median Age N 1011 South Second Street Springfield, IL 62704 Ph. (217) 525-1173 Website: www.gscc.org City of Springfield, Illinois Office of Planning & Econ. Development 800 E. Monroe, Room 107 Springfield, IL 62701 Ph. (217) 789-2377 Website: www.springfield.il.us/oped A Guide to Retail: Lincolnwood Development Demographics: Lincolnwood Dev. 3 Miles 5 Miles 1 Mile Lincolnwood Development – Sitting at the southern entrance to the city where I-55/I-72 connect, this development provides easy interstate access from any direction. Plans to complete 11th Street to the north will open additional access from in town. Proximity to the growing University and the city’s newest Wal-Mart make this location among the most appealing in the region.
Marketplace Profile Legend Retail Chain Restaurant Local Restaurant Convenience/Gas Lodging Grocery Local Retail/Service Banks Office Available Sites Entertainment Traffic Counts in Blue N 1011 South Second Street Springfield, IL 62704 Ph. (217) 525-1173 Website: www.gscc.org City of Springfield, Illinois Office of Planning & Econ. Development 800 E. Monroe, Room 107 Springfield, IL 62701 Ph. (217) 789-2377 Website: www.springfield.il.us/oped A Guide to Retail: Lincolnwood Development 28,500 Fit Club Fed Ex Eleventh St Extension Travelodge 7,900 Car Dealership 7,500 Road Ranger 9,200 Golden Corral 25,700 48,900 31,200
Location & Economies 9,271 9,996 9,906 8,707 12.6% 16.3% 15.8% 18.4% 19.5% 9.4% 5.8% 2.1% 4,475 4,607 4,685 4,249 $52,244 13.0% 9.6% 17.3% 20.2% 18.3% 13.4% 8.2% 36.0 66,496 71,734 69,674 64,350 16.1% 14.2% 12.0% 14.8% 18.1% 10.9% 9.7% 4.2% 30,647 31,822 31,533 29,925 $59,715 12.2% 11.1% 15.1% 18.5% 20.4% 13.8% 8.9% 38.5 118,690 119,200 119,766 118,346 15.5% 13.3% 11.4% 14.9% 17.9% 11.4% 10.5% 5.0% 52,922 51,092 52,700 53,116 $62,518 12.4% 11.5% 14.5% 18.6% 21.0% 13.7% 8.2% 38.4 Population ‘10 Est. Population ‘90 Census Population ’00 Census Population ‘15 Proj. Population Household Income Dist. <$14,999 $15,000-$24,999 $25,000-$34,999 $35,000-$49,999 $50,000-$74,999 $75,000-$99,999 $100,000-$149,999 $150,000> Households 2010 Estimate 1990 Census 2000 Census 2015 Projected Average HH Income Age Distribution 0-9 10-19 20-29 30-44 45-59 60-74 75+ Median Age Population ‘10 Est. Population ‘90 Census Population ’00 Census Population ‘15 Proj. Population Household Income Dist. <$14,999 $15,000-$24,999 $25,000-$34,999 $35,000-$49,999 $50,000-$74,999 $75,000-$99,999 $100,000-$149,999 $150,000> Households 2010 Estimate 1990 Census 2000 Census 2015 Projected Average HH Income Age Distribution 0-9 10-19 20-29 30-44 45-59 60-74 75+ Median Age Population ‘10 Est. Population ‘90 Census Population ’00 Census Population ‘15 Proj. Population Household Income Dist. <$14,999 $15,000-$24,999 $25,000-$34,999 $35,000-$49,999 $50,000-$74,999 $75,000-$99,999 $100,000-$149,999 $150,000> Households 2010 Estimate 1990 Census 2000 Census 2015 Projected Average HH Income Age Distribution 0-9 10-19 20-29 30-44 45-59 60-74 75+ Median Age N 1011 South Second Street Springfield, IL 62704 Ph. (217) 525-1173 Website: www.gscc.org City of Springfield, Illinois Office of Planning & Econ. Development 800 E. Monroe, Room 107 Springfield, IL 62701 Ph. (217) 789-2377 Website: www.springfield.il.us/oped A Guide to Retail: Iles Junction Demographics: Iles Junction 3 Miles 5 Miles 1 Mile Iles Junction – This proposed development is along the recently constructed Stanford Avenue, which connects to both MacArthur Boulevard and Wabash Avenue. CVS, Aaron’s Rental, Darcy’s Pint and O’Reilly Auto Parts have recently constructed new establishments along this growing corridor.
Marketplace Profile Legend Retail Chain Restaurant Local Restaurant Convenience/Gas Lodging Grocery Local Retail/Service Banks Office Available Sites Entertainment Traffic Counts in Blue N 1011 South Second Street Springfield, IL 62704 Ph. (217) 525-1173 Website: www.gscc.org City of Springfield, Illinois Office of Planning & Econ. Development 800 E. Monroe, Room 107 Springfield, IL 62701 Ph. (217) 789-2377 Website: www.springfield.il.us/oped A Guide to Retail: Iles Junction Ayerco Gas Subway 20,400 24,600 Antonio’s Pizza D’Arcy’s Pint O’Reilly Auto Parts 24,600 CVS Aaron’s Rental Show-Me’s
City of Springfield, Illinois Office of Planning & Econ. Development 800 E. Monroe, Room 107 Springfield, IL 62701 Ph. (217) 789-2377 Website: www.springfield.il.us/oped The Quantum Growth Partnership 1011 South Second Street Springfield, IL 62704 Ph. (217) 525-1173 Website: www.gscc.org