Download
1 / 40
430 likes | 635 Views
Modeling Active Traffic Management for the I-80 Integrated Corridor Mobility (ICM) Project. Terry Klim , P.E. Kevin Fehon, P.E. DKS Associates D. Simulation of Active Traffic Management Elements. Adaptive Ramp Metering Variable Speed Limits (VSL)

E N D
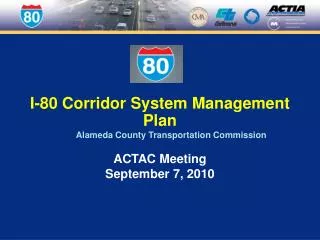
Modeling Active Traffic Management for the I-80 Integrated Corridor Mobility (ICM) Project Terry Klim, P.E. Kevin Fehon, P.E. DKS Associates D
Simulation of Active Traffic Management Elements • Adaptive Ramp Metering • Variable Speed Limits (VSL) • Incident Lane Management/Lane Control Signs
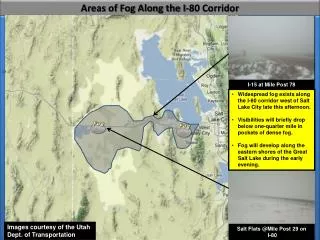
The I-80 Corridor • 21-mile segment from Carquinez Bridge to Bay Bridge • Major parallel arterial (San Pablo Avenue)
Project Need • One of most congested corridors in Bay Area • Extensive congestion AM, PM and weekends • High accident rate along the freeway • Projected 30-45% demand increase by 2035 • Limited room for physical improvements
ATM Project Elements • Area-wide adaptive ramp metering • Meters installed at all ramps in both directions • Variable speed limits • Signs installed throughout corridor in both directions • Overhead lane control signals • Signs installed in westbound direction, within high-incident segment only
Simulation Approach • Corridor modeled using Paramics • Multi-hour AM (6 to 10 AM) and PM (2 to 7 PM) peak periods • Simulated both recurring and incident conditions • Involved application of: • New Ramp Metering and Lane Management plug-ins • Recently-added VSL module
Model Network • Over 25 miles of Freeway • 92 ramps • Over 50 miles of arterial roadway • 55 signalized intersections
Adaptive Ramp Metering • Plan is for area-wide adaptive metering • Exact algorithm still being defined
Ramp Metering - Testing • Applied existing algorithm used by Caltrans District 4 (TOS 2.0) • “Locally adaptive” • Requires rate-vs-occupancy look-up tables • Includes “queue detection/override” capability • Metering active only WB in AM, both directions in PM
Ramp Metering – Plug-in • Developed by CLR Analytics • Requires user-supplied input file in XML format • Rate look-up tables • Start-up and shutdown control parameters • Queue override parameters 15
Ramp Meter – Modeling Insights • Additional network coding • Detectors • Splitting of multi-lane ramps • Development of metering rate-vs-occupancy look-up tables • Plug-in limitations: • Lack of automated “all green” • Number of meter lanes 16
Ramp Metering – Results • Ramp Metering provides improvement to the freeway without degrading arterial operation • I-80 hours of delay decrease by 20% in the westbound direction • Limited benefit eastbound due to pattern of congestion – most heavily congested at start of corridor • System wide hours of delay decreases by 8% • Negligible change in arterial hours of delay
Variable Speed Limits • General philosophy: • Modify upstream speed limits based on downstream conditions • Strategy objective evolved during study • Speed harmonization - slow traffic approaching bottlenecks to smooth speed profile and improve flow • End-of-queue warning during incidents
VSL - Testing • Examined as stand-alone “speed harmonization” strategy for AM westbound direction only • Tested over 30 VSL scenarios • Included in incident analysis for both directions and peak periods
VSL Module Added to Version 6 at our request for this project Allows for adjustment of speed limit based on lookup tables and monitored conditions Requires coding of: VSL routes - segments where VSL can be applied VSL rules – if/then rules identifying under what conditions speed limits will be modified Mainline detectors
VSL Module - Routes VSL Route 1 Detector Group 1 VSL Route 2 Detector Group 2 VSL Route 3 Detector Group 3
VSL Module - Rules Detector polling interval: allows the user to set how often data is gathered from loop detectors Transition time: the period of time to go from the current speed limit to the new target speed Settling time: the time that must elapse between two concurrent changes to speed limits
VSL – Modeling Insights • Module was easy and straightforward to use • Challenge: • Defining appropriate rules and parameters • Module limitations: • Inability to set segment-to-segment rules • Enforceable vs advisory speed limits – driver response • HOV Lane speed limit
VSL – Results • Produced an increase in average freeway travel time and delay • One scenario yielded a decrease • Reduced delay within congested, downstream segment • Key benefit is expected reduction in rear-end accidents
Incident Lane Management General philosophy: “Close” lane(s) upstream of incident Use overhead gantry signs to provide warning of downstream incident/lane closure Objective is to provide for earlier and smoother transition/lane changing in advance of incident
Incident Lane Management Sample Lane Control Sign and VSL combination
Lane Management - Testing • Focused on AM westbound • Involves: • Initiating incident directly within Paramics • “Activating” lane management after a short delay to simulate time to detect incident • Tested several incident scenarios
Lane Management – Plug-In Developed by CLR Analytics Requires XML input file Lane closure zone/links Decision zone/links in which drivers change lanes CMS messages Start/end time
Closure Link Closure Link Decision Link Decision Link Right lane closed ahead Right two lanes closed ahead Lane Management – Plug-In Model
Lane Management – Modeling Insights • Plug-in was easy and straightforward to use • Challenge: • Validation of results • Limitation: • “Zones” are defined by links rather than distance
Lane Management Results • Improved flow past incident location in all cases • Reduced delay on freeway, as well as arterials • Level of benefit varied significantly based on incident details
Institutional Challenges/Issues • Lack of ATM experience • Uncertainty about how to apply/use the ATM elements • Stakeholder skepticism • Desire for “exact” results
Conclusions • Paramics provided excellent vehicle to simulate active freeway management strategies • New VSL module and plug-ins worked as expected – but have limitations • ICM Project is moving forward with all ATM elements, although objectives have evolved