0 likes | 2 Views
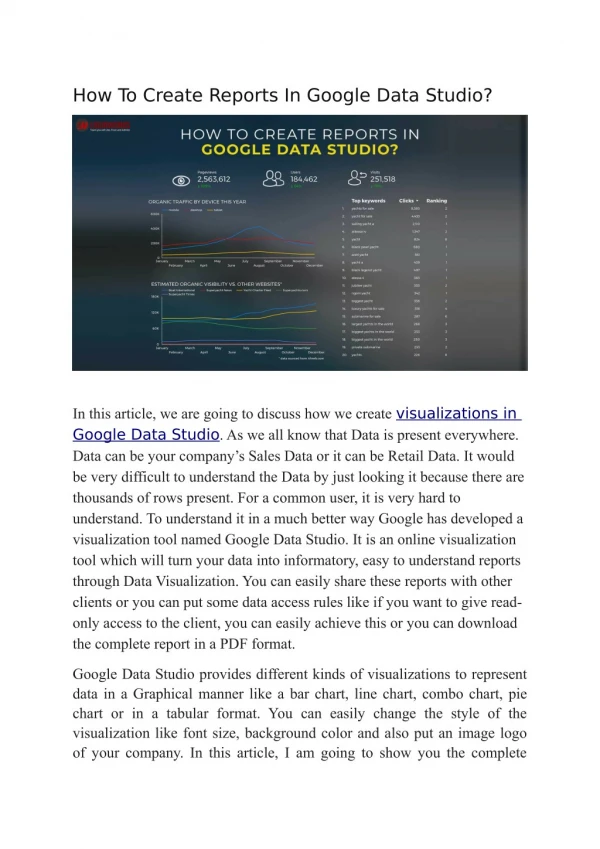
Everywhere your eyes roll, you see data, in the website, the campaigns, the pages, and the products. Data is the life and blood of any organisational success. Unleashing the power of data can offer exponential growth. However, handling the flood of data can be staggering, and much useful data can go unnoticed if not managed effectively. So, how do you filter data and extract meaningful analysis to drive decisions based on data? The answer is Google Data Studio or Looker Studio.
E N D
How To Use Google Data Studio For Maximum Benefit Unlock the Power of Data Visualization in 2025
The Role of Data in Organizational Success Data is everywhere: websites, campaigns, pages, products Drives exponential growth when leveraged effectively Managing data floods can be challenging without the right tools Solution: Google Data Studio (rebranded as Looker Studio)
Understanding Google Data Studio Cloud-based data reporting and BI tool by Google Rebranded as Looker Studio in 2022 (no new features added) Creates custom dashboards, KPI tracking, trend visualization Supports real-time reporting, data blending, and Google platform integration
Key Advantages of Google Data Studio Integrates with 800+ data sources (e.g., Google Analytics, Facebook Ads) Intuitive smart reports with drag-and-drop charts (no coding needed) Looker Studio API automates report management Real-time collaboration and sharing like Google Docs Free and cloud-based, accessible anywhere
Practical Applications Digital marketing: Monitor ROI across platforms (Facebook Ads, Google Analytics) eCommerce: Daily sales and customer behavior insights Large organizations: Bulk-assign editors via API Startups: Use free tools without BI software costs
Limitations to Consider Requires good internet (no offline use) Most connectors are paid Limited integration with third-party tools Caps at 20 conditional formatting, 50 charts/boxes, 12 widgets per page Restrictions on data points
How to Use Google Data Studio Step 1: Log in with Google account (Analytics, Ads, Search Console) Step 2: Explore sample dashboards and tutorials Step 3: Identify Reports and Data Sources Step 4: Connect your first data source (e.g., Google Analytics)
Step-by-Step Report Creation Step 1: Add Data Source (e.g., Google Analytics) Step 2: Insert Widgets (Pie Charts, Bar Charts, Time Series) Step 3: Customize Widgets (metrics, dimensions, comparison periods) Step 4: Design Theme (colors, fonts, layouts) Step 5: Embed External Content (Google Sheets, YouTube) Step 6: Share with stakeholders
Enhancing Your Report Customize metrics (e.g., Sessions to Pageviews) Adjust dimensions (e.g., Date to Landing Page) Add comparison periods for performance analysis Embed live documents or media for context Example: Compare monthly traffic growth
Why Google Data Studio Matters Turns raw data into meaningful stories Offers intuitive tools, endless connectors, and powerful visuals Builds clarity, confidence, and smarter strategies Suitable for beginners and data pros alike
Frequently Asked Questions Is Google Data Studio still free? Yes, now called Looker Studio, it’s free What is Google Data Studio called now? Looker Studio (rebranded 2022) Is Looker Studio better than Tableau? Great for Google data, free; Tableau for advanced analytics What is Looker Studio used for? Interactive dashboards and visual reports Is Looker Studio free or paid? Free version; Looker Studio Pro is paid