Download
1 / 40
400 likes | 572 Views
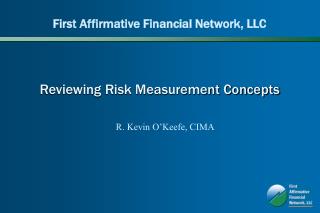
Reviewing Risk Measurement Concepts. First Affirmative Financial Network, LLC. R. Kevin O’Keefe, CIMA. What we will cover. Beta Standard Deviation Sharpe Ratio R-squared Correlation Coefficient How they interrelate. Limitations and Uses. Limitations:

E N D
Reviewing Risk Measurement Concepts First Affirmative Financial Network, LLC R. Kevin O’Keefe, CIMA
What we will cover • Beta • Standard Deviation • Sharpe Ratio • R-squared • Correlation Coefficient • How they interrelate
Limitations and Uses Limitations: Cannot predict specific events Are historical, backward-looking Uses: Can help improve portfolio construction Can help identify unwanted exposure Can help defend investment decisions
Beta A measure of a security’s sensitivity to market movements It is a relative measure, not an absolute measure of volatility It does not tell you enough; you need to know the R-squared.
Estimating Beta: Fund 1 R1 Rm -15 -20 30 40 What is the slope (rise / run)?
Estimating Beta: Fund 1 45 60
Estimating Beta: Fund 1 Rise / run = 45 / 60 = .75 This is easy! But … What happens when the data get more complex?
Estimating Beta: Fund 2 R2 Rm 3 -30 15 20 20 10 -10 -40
Estimating Beta: Fund 2 Regression line Beta = .42
Beta : Example Fidelity Select Gold Fund Beta: 0.25 Std Dev: 31.28 R-squared: 2
Beta: The Details • The beta of a portfolio is the weighted average of the individual betas of the securities in the portfolio. • Half the securities in the market have a beta > 1, and half have a beta < 1. • You cannot diversify away beta.
Standard Deviation Standard deviation defines a band around the mean within which an investment’s (or a portfolio’s) returns tend to fall. The higher the standard deviation, the wider the band.
Standard Deviation Assumes normal distribution (bell-shaped curve)
Standard Deviation 68.3% 95.5% -2 SD -1 SD +1SD +2 SD
Standard Deviation Q. What does it mean that a portfolio’s standard deviation is x%? • It means that x = 1 standard deviation (which allows you, therefore, to say something statistically meaningful about the range of probable returns.)
Standard Deviation 68.3% 95.5% -2 SD -1 SD +1SD +2 SD
Standard Deviation Trick Question: Which portfolio is riskiest? A B C Mean return 7% 20% 30% Standard dev. 3% 6% 15%
Standard Deviation Answer: It depends on your definition of risk! Does “risk” mean … Probability of loss? Magnitude of loss? Probability of underperforming target?
Standard Deviation Trick Question: Which portfolio is riskiest? A B C Mean return 7% 20% 30% Standard dev. 3% 6% 15%
Beta vs. Standard Deviation Two Funds: Same Slope Same Intersect Same Characteristic Line What statistical measure is identical for these two funds?
Beta vs. Standard Deviation Two Funds: Which will exhibit greater variability (i.e., higher standard deviation)? Which has more securities? Which has the higher R2?
Fund A Greater variability Higher standard deviation? Fewer securities Lower r-squared Fund B Less variability Lower standard deviation? More securities Higher r-squared Beta vs. Standard Deviation
R-Squared “Tightness of fit around the characteristic line” OR, if you prefer, “the percentage of a portfolio’s fluctuations that can be explained by fluctuations in its benchmark index” Relates to beta, not standard deviation Tells you how much significance there is to the beta: higher R2 = greater significance
Sharpe Ratio Sharpe Ratio = Excess Return* Standard Deviation *Above the risk-free rate 1.The number is meaningless except in a relative context. 2.Based on Standard Deviation, not Beta, thus more meaningful at the portfolio level rather than at the component level.
Correlation Coefficient Meaningful at the component level The Myth of Negative Correlation Correlation coefficients are cyclical; they strengthen and weaken over time
Risk Adjusted Measures Total risk = Market risk + non-market risk All measures must be contextualized Standard Deviation: 1. Don’t forget to account for returns 2. “Risk” must be defined 3. Remember that standard deviation measures upside volatility as well as downside.
Risk Adjusted Measures Beta: 1. Don’t forget to account for R2. 2. A useful measure, but insufficient in portfolio construction …
Risk Adjusted Measures Sharpe ratio: 1. Meaningless number, except as a way of comparing different portfolios over an identical period. 2. Measures absolute risk (vs. relative risk).
Risk Adjusted Measures Correlation Coefficients: 1. Fluctuate over time 2. Remember to factor in expected returns
Limitations and Uses Limitations: Cannot predict specific events Are historical, backward-looking Uses: Can help improve portfolio construction Can help identify unwanted exposure Can help defend investment decisions