Download
1 / 13
130 likes | 289 Views
U.S. Environmental Protection Agency Natural Gas STAR Program. Overview for Distribution Companies Reducing Emissions Increasing Efficiency Maximizing Profits. CH 4 10%. CO 2 83%. N 2 O 4%. Other 15%. Landfills 17%. HFCs, PCs, & SF 6 2%. Coal Mining 10%. Enteric Fermentation 20%.

E N D
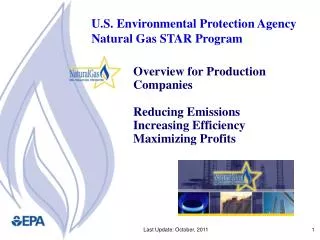
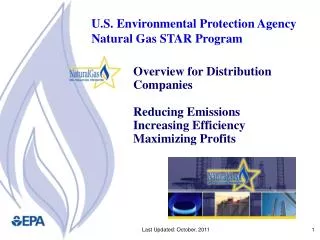
U.S. Environmental Protection Agency Natural Gas STAR Program Overview for Distribution CompaniesReducing Emissions Increasing EfficiencyMaximizing Profits Last Updated: October, 2011
CH4 10% CO2 83% N2O 4% Other 15% Landfills 17% HFCs, PCs, & SF6 2% Coal Mining 10% Enteric Fermentation 20% Oil and Gas Systems 37% Background: U.S. Greenhouse Gas Emissions U.S. Greenhouse Gas EmissionsAll Sources Oil and natural gas systems are the largest man-made source of methane emissions in the United States (37%) and make up 3.8% of total U.S. greenhouse gas emissions U.S. Methane Emissions by Sector Source:EPA, Inventory of U.S. Greenhouse Gas Emissions and Sinks 1990 – 2009, April, 2011. Note: Totals may not sum due to independent rounding.
Background: U.S. Oil and Gas Methane Emissions by Sector • 2009 U.S. methane emissions from oil and natural gas industry: 624 Bcf (3.8% of total U.S. greenhouse gas emissions) Bcf = billion cubic feet Source: EPA. Inventory of U.S. Greenhouse Gas Emissions and Sinks 1990 – 2009. April, 2011. Available on the Web at: www.epa.gov/climatechange/emissions/usinventoryreport.html.Note: Totals may not sum due to independent rounding.
Background: Distribution Sector Methane Emissions (72 Bcf) Protected Steel Mains/Services 4 Bcf Bcf = billion cubic feet Other Sources 3 Bcf M&R Stations 18 Bcf Plastic Mains/Services 6 Bcf Cast Iron Mains 8 Bcf Regulator Stations 11 Bcf Source: EPA. Inventory of U.S. Greenhouse Gas Emissions and Sinks 1990 – 2009. April, 2011. Available on the Web at: www.epa.gov/climatechange/emissions/usinventoryreport.html.
U.S. Oil & Natural Gas Opportunities: Why Gas STAR? • 624 Bcf of methane emissions per year amounts to: • $2.5 B worth of gas lost (at $4/Mcf) • CO2 emissions from the electricity use of 30.63 million homes for one year • Annual greenhouse gas emissions from 48.25 million passenger vehicles • U.S. oil and natural gas industry has an opportunity to cost-effectively reduce methane emissions resulting in: • Increased operational efficiency • Increased profits • Increased domestic gas supply • Improved safety • Improved environmental performance • Better public relations
The Natural Gas STAR Program The Natural Gas STAR Program is aflexible,voluntary partnershipbetween EPA and the oil and natural gas industry designed tocost-effectivelyreduce methane emissions from oil and natural gas operations. • More Than 130 Partners: For a complete listing of Natural Gas STAR partner companies and industry association endorsers, visitepa.gov/gasstar/partners/index.html
Key Components • Guidance on new technologies and practices • Technical documents on more than 80 cost-effective technologies and practices • Free Technology Transfer workshops • Technical guidance to identify and prioritize cost-effective methane emission reduction opportunities • Annual record of partner voluntary actions and methane savings Technical Information Workshops Annual Reports Project Demonstrations
Benefits to Participation • Save time identifying the “right” technologies and practices to reduce methane emissions and increase revenue • Technical information and economic analyses based on partner companies’ field experiences • One-on-one assistance to identify and prioritize cost-effective projects appropriate for a company’s operating environment • Build network with industry peers, draw upon their experience and success • Sector specific Technology Transfer Workshops and Annual Implementation Workshops • Minimal resources required to administer the Program—these are provided: • Standardized forms and default emission values • Data collection software and online reporting • Gas STAR technical support staff • Enhanced corporate reputation • Public recognition and easy methods to quantify environmental benefits • Voluntary record of reductions and benchmarking reports detailing accomplishments
Key Steps to Participation • Step 1:Sign the Memorandum of Understanding (MOU) and market Gas STAR internally—develop a supportive corporate environment from the beginning. • Step 2:Submit an Implementation Plan outlining how Gas STAR will be incorporated into company operations. • Step 3:Participate in the Gas STAR Program based on corporate goals and resources, act on cost-effective methane emission reduction opportunities, attend workshops, and report activities and accomplishments. • Step 4:Submit annual progress reports (after one full year of participation) documenting the previous year’s achievements.
Accomplishments • Through participation in the Natural Gas STAR Program, partners reduced methane emissions by 94 Bcf in 2010. • 994 Bcf in cumulative reductions since 1993
Consolidated Edison Case Study(Joined 1993) Program Implementation to Ensure Success • Natural Gas STAR became a focal point for open communication and teamwork which was one way to put corporate environmental policy into action • Highly successful in implementing and advocating through technology transfer workshops the benefits of cast iron pipe replacement and flexible pipe lining methods Examples: Key Achievements and Contributions • Development and use of Cast Iron Joint Sealing Robot (CISBOT) since 2000 to seal leaking joints with an anaerobic sealant • Prevents service disruption, allows minimal excavation • Reduces pipeline repair costs by 30 to 40% • Participated in workshops, generously shared successes • Achieved multiple Gas STAR awards including a Continuing Excellence award in 2005
Resources and Contact Information • Learn more about Natural Gas STAR, visit: epa.gov/gasstar • Detailed information on recommended technologies and practices: epa.gov/gasstar/tools/recommended.html • Gas STAR forms including MOU, Implementation Plan, and Annual Reporting forms: epa.gov/gasstar/tools/program-forms.html • Additional information on implementing the Natural Gas STARProgram: epa.gov/gasstar/guidelines/index.html
Scott Bartos (202) 343-9167bartos.scott@epa.gov Jerome Blackman (202) 343-9630 blackman.jerome@epa.gov Carey Bylin (202) 343-9669 bylin.carey@epa.gov Roger Fernandez (202) 343-9386 fernandez.roger@epa.gov Suzie Waltzer (202) 343-9544 waltzer.suzanne@epa.gov Contact Information