Download
1 / 10
100 likes | 209 Views
WMO Cloud Modeling workshop, Warsaw, July 2012 Idealized Oklahoma squall Line. 20 june 2007, reflectivity mosaic. WMO Cloud Modeling workshop, Warsaw, July 2012 Observations. Observation KOUN radar. 20 june 2007, reflectivity mosaic. WMO Cloud Modeling workshop, Warsaw, July 2012

E N D
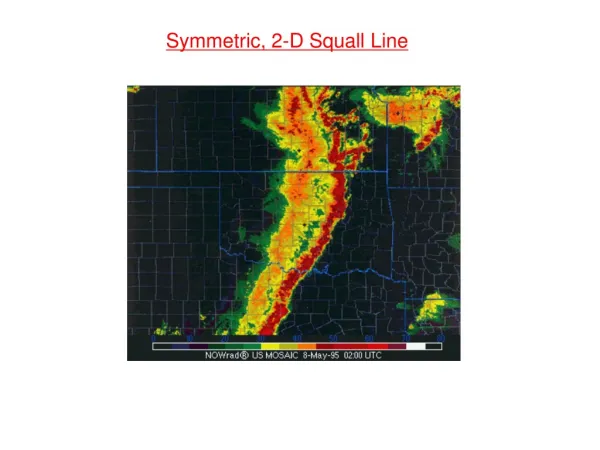
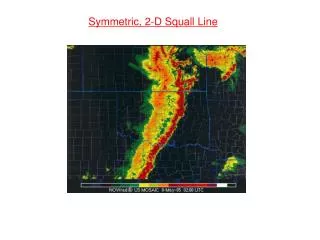
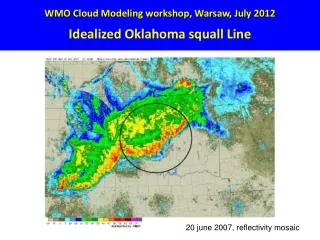
WMO Cloud Modeling workshop, Warsaw, July 2012Idealized Oklahoma squall Line 20 june 2007, reflectivity mosaic
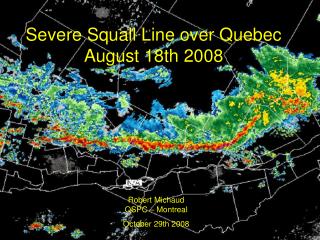
WMO Cloud Modeling workshop, Warsaw, July 2012Observations Observation KOUN radar 20 june 2007, reflectivity mosaic
WMO Cloud Modeling workshop, Warsaw, July 2012 Idealized modeling deep convection Modeling with DESCAM3D: bin (droplets and crystals) resolved cloud microphysics within a 3D dynamical model (dx, dy= 1km, dz =250m) flow
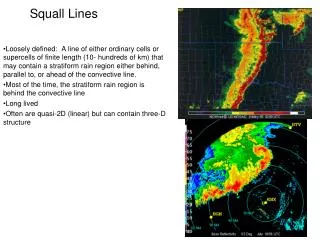
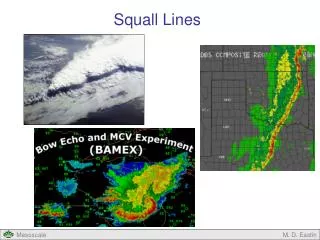
WMO Cloud Modeling workshop, Warsaw, July 2012 Modeling deep convection Due to a strong wind shear forcing a convective system develops which is similar to a tropical squall line in horizontal and vertical extension.
WMO Cloud Modeling workshop, Warsaw, July 2012 Idealized modeling deep convection strong spatial variability in TWC maxima 30 km north model center 30 km south
WMO Cloud Modeling workshop, Warsaw, July 2012 Idealized modeling deep convection A significant variability in TWC appears ranging between 2-9 g/m3Horizontal cross section at z = 10 km
Partitioning of TWC – LWC – IWC at 10 km (after 280 min) TWC (g m-3) LWC (g m-3) IWC (g m-3)