Download
1 / 26
260 likes | 402 Views
Leadership Training to Improve Curriculum, Instruction, and Achievement: Evidence from Michigan Schools. Roger Goddard, Senior Fellow, McREL Dan Reattoir, Superintendent, Eastern Upper Peninsula ISD MAISA June 19, 2013. Overview of This Best Practice Session.

E N D
Leadership Training to Improve Curriculum, Instruction, and Achievement: Evidence from Michigan Schools Roger Goddard, Senior Fellow, McREL Dan Reattoir, Superintendent, Eastern Upper Peninsula ISD MAISA June 19, 2013
Overview of This Best Practice Session • Leadership as a Driver of Improvement • A Federal Randomized Control Trial to Evaluate McREL’s Balanced Leadership Program • Preliminary Findings from the Evaluation • Balanced Leadership and Beyond in the EUPISD • Results in the EUPISD
The general effect of school level leadership Average correlation (r) between principal leadership behavior & school achievement is .25. This means … A one standard deviation increase in principal leadership is associated with a 10 percentile point gain in school achievement.
School Leadership and Improvements in Curriculum and Instruction • How do you guarantee low variability and high qualityamong classrooms in instruction? • Distinguishing between Beating the Odds and Changing the Odds • Meta-analytic Findings on School Leadership • Waters, Marzano, & McNulty (2003) • Average Impact of Leadership factors ES .25 • Robinson, Lloyd, & Lowe (2008) • Instructional Leadership Statistically Linked to Achievement • Instructional Leadership 3x more strongly related to achievement compared to transformational leadership
Principal A Principal B 2.14 13.59 34.13 34.13 13.59 2.14 -4 -3 -2 -1 0 1 2 3 4 Differences in teacher ratings of principal leadership
Mean student achievement = 50th percentile Mean student achievement = 60th percentile School B School A Effect Size = .25 Difference in mean student achievement
A Randomized Control Trial to Assess the Efficacy of the Balanced Leadership Program • Collaborative large-scale experimental leadership research project in Northern Michigan • 17 ISDs, 74 Districts, and 126 Elementary Schools • To assess the fidelity and causal impacts of McREL’s Balanced Leadership Program • Random assignment with training for control schools after final outcome data. • Two year, 10 two-day session BL program
Purposeful Community School-level leadership District-level leadership Purposeful Community Purposeful Community District-level leadership School-level leadership Purposeful Community McREL’sBalanced Leadership Framework™ FOCUS MAGNITUDE Big problems of practice
Balanced Leadership Evaluation Overview • Rigorous Design to Assess Causality • Stratified Random Assignment • Leveraging chance • Impact on • Principals’ Leadership and School Climate • Principal and Teacher Turnover
Source: Miller, R. J., Goddard, R. D., Kim, E.S., Goddard, Y., L. & Schroeder, P. (2011). Evaluation of principals’ professional development learning: Results from a randomized control trial. Paper presented at the annual conference of the University Council for Educational Administration, Pittsburgh, PA. Hedges’sg Effect Size for Balanced Leadership Training Impact on Principals (n = 95)* Note. * ES .25 substantively significant for experimental research (What Works Clearinghouse, 2008).
Balanced Leadership Impact on Principal and Teacher Turnover • Does the Balanced Leadership Program cause changes in principal and teacher turnover? • After the two years of training, compared to control schools: • Principals in the treatment schools were 20% less likely to leave • Teachers in the treatment schools were 7% less likely to leave
2005/2006 • Provided a Framework • Curriculum • Instruction • Assessment • Team of Administrators • Local District Principals • Local District Superintendents • ISD Staff • Numerous Book Studies
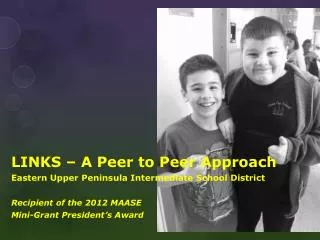
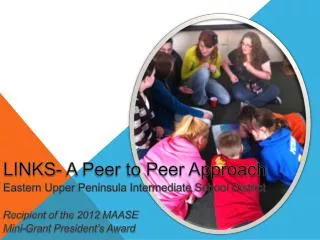
2005- Regional CurriculumEfforts Begin • C = Curriculum • R = Review • T = Teams • CRTs formed in an attempt to provide a forum for all local districts to collaborate, at the teacher and content level, around curriculum “matters.” • Started with Math & ELA. Teams for Science, Social Studies, World Languages, Visual & Performing Arts, Physical Education, and Health have since been formed.
2005 – Freedom to Learn Initiative • Statewide One-to-One Laptop-to- Student Initiative • Jump-started student level access to curriculum and assessments • Began process of integrating technology into classroom practices at instructional level
2006 – Common RegionalAssessment Efforts • Used FTL computers and have students begin taking on-line, common, regional assessments. • Originally used Scantron Assessment Connection to build tests, delivered using Microsoft Class-Server, imported data into regional data system – Data Director • Cumbersome but powerful • Assessments are now taken directly through Data Director. Seamless process with immediate turnaround on reports for teachers
2007 – Balanced Assessment Training • Creating and using well done assessments is hard! • Partnered with Wexford-Missaukee ISD on E2T2 grant • Trained a large cohort of teachers and ISD staff on Stiggins Balanced Assessment process • These teams became involved in the process of refining and creating new common, regional assessments • These strategies are still employed as common assessments, are tweaked and new assessments are created
2009 – Balanced Leadership Efforts • Originally exposed to Balanced Leadership through Freedom to Learn ongoing professional development (for administrators) • Book studies; UPCED, EUP principals, ISD staff • Involvement in Dr. Goddard’s efficacy study
2010 – Broadband Technology Opportunities Program • Another opportunity to boost technology use for students and families • Provided netbooks for students 6-12 • Greatly expanded access to online teaching and learning tools • Greatly expanded access to professional development for teachers and families “Sparking Broadband Use in the Eastern Upper Peninsula of Michigan”
2011 – Classroom Observations and Power Walkthroughs • Initiated by elementary principals as a way to more efficiently collect data on research based instructional strategies often embedded in school improvement plans. • Introduced in 2011, in full use in 2012 and 2013. • Good baseline data established / Great teacher – admin discussions initiated
2012 – Using Technology in the Classroom that Works • This training really brought together the Power Walkthroughs, the BTOP grant, and overall best practices in the 21st Century Classroom • Supported by embedded PD offerings throughout BTOP project and through ongoing classroom observations
Best Practices / SBAC Readiness • Several systems in place. • Student achievement improving. • SBAC readiness enhanced.