Download
1 / 35
350 likes | 432 Views
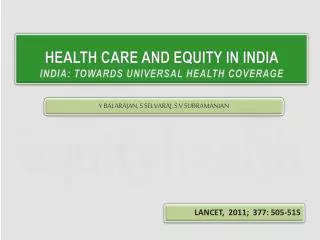
Equity in health and health care: lessons from an Asian comparative study. Eddy van Doorslaer Erasmus School of Economics & Erasmus Medical Centre Rotterdam Merck Foundation Lecture London School of Economics, 16 March 2007. 2. Introduction - background.

E N D
Equity in health and health care:lessons from an Asian comparative study Eddy van Doorslaer Erasmus School of Economics & Erasmus Medical Centre Rotterdam Merck Foundation Lecture London School of Economics, 16 March 2007
2 Introduction - background • Inequality and inequity in the distribution of • Health • Health care • Health care payments • Some analogies with measurement of income inequality, but not perfect • Approaches to study equity in health care finance and delivery in high-income (EU/OECD) countries, developed in ECuity Project • Usefulness for low-to-middle income countries, examined in EQUITAP Project (Asian-Pacific)
Draws on several papers • Van Doorslaer, E, O O’Donnell, R Rannan-Eliya et al (20 authors) Effect of payments for health care on poverty estimates in 11 countries in Asia: an analysis of household survey data, The Lancet, 2006, 368, Dec • O’Donnell, O, E van Doorslaer, R Rannan-Eliya et al (18 authors) The incidence of public spending on health care: comparative evidence from Asia, World Bank Economic Review, (Published online, Jan 2007) • Van Doorslaer, E, O O’Donnell, R Rannan-Eliya et al (23 authors) Catastrophic expenditures on health care in Asia, Health Economics, (Published online, Feb 2007)
I. Distribution of health care payments • In OECD context: mostly publicly financed health care systems with universal coverage have disconnected receipt of care from payment for care • Payments according to ability to pay • Tools of progressivity and redistribution can be used to examine health payments by income • Descriptive x-country comparative results informative on potential consequences of alternative health care financing choices • E.g out-of-pocket payments most regressive source
The health care financing triangle - OECD(Wagstaff, Van Doorslaer et al, JHE, 1999)
Overall progressivity hc finance — OECD(Wagstaff, Van Doorslaer et al, JHE, 1999)
Distribution of health care finance • In low-income settings: high shares of out-of-pocket spending, small pre-paid shares • And receipt of care linked to payment for care • Payments largely according to use • Tools of progressivity and redistribution can be very misleading • Rich pay more, even in proportion to their income • Interest in (lack of) prepayment and protection against income loss
Health care financing triangle – Asia(O’Donnell, Van Doorslaer et al, 2006)
Inequality and progressivity – total health care payments, Asia(O’Donnell et al, 2006)
Measures of income protection of interest • High health expenditure out-of-pocket (OOP) can affect household welfare through • Effect on health care use: see BIA • Effect on living standards: income protection • Wagstaff and van Doorslaer (2003) proposed to look at measures of ‘impact’ of OOPs on • Incidence and intensity of high or catastrophic expenditure • Incidence and intensity of poverty changes
Impoverishment • Most health spending in low-income settings not discretionary • Standard poverty headcount and gap measures do not account for health needs • Variability and unpredictability of OOPs makes adjustment of poverty line for health needs difficult • How many more individuals are below the poverty line – and by how far – if OOP spending is deducted from total spending? • Change in headcount and gap makes ‘hidden poor’ visible
Some EQUITAP Project findings – Asia(Van Doorslaer et al, Lancet, 2006) • Estimated increase in poverty headcount from 19.3% to 22% of total population (so plus 2.7% of population) • or an extra 78.25 million Asian people poor • who are currently not counted as poor because their OOP health spending lifts them above poverty line • Largest relative increases in Bangladesh, India, China and Vietnam • Magnitude clearly linked to OOP finance share and to population share at risk • But again, even at similar OOP share levels, some countries appear more successful at protecting living standards than others. So not just a question of affordability
II. Distribution of health care utilisation in rich countries (Van Doorslaer et al, CMAJ, 2006) • In OECD context: horizontal equity (HE) concern requires equal treatment for equal need, irrespective of income • Measurement of inequality in need-standardised distribution of use by income • Norm = average relationship between use and need • Many systems close to achieving HE, but varies by type of care E.g.: • GP care often pro-poor • specialist care everywhere pro-rich • more pro-rich when private options available
Access to health care in Asia? • In low-income countries: self-reported health measures often show less pro-poor gradient in LDCs • Unlike more objective indicators of need • Need measurement problematic • Therefore: assume need is equal or at least not pro-rich • and look at distribution of actual utilization, i.e. unadjusted for need
21 Poor kids more likely to die before age five
22 But poor kids and mothers less likely to receive health services
Who makes use of public health services? Benefit-incidence analysis (BIA) Important to realize: • Even if benefits not distributed according to needs • In-kind transfers still achieve a welfare redistribution • even if incidence itself is pro-rich • if incidence of public expenditure less concentrated among the rich than income itself • Use formal tests of stochastic dominance • to compare concentration curves of public health subsidy with diagonal and Lorenz curves
Example: concentration of public health subsidy in Malaysia and India
BIA of public health subsidy – Asia(O’Donnell, Van Doorslaer et al, WBER, 2007) Pro-rich Inequality- increasing Pro-poor Inequality- reducing
Cross-country dominance results – Asia(O’Donnell, Van Doorslaer et al, WBER, 2007) D= Stochastic Dominance (more pro-poor) ; * = strict dominance ; ns = not signif 5%
Cross-country dominance results – Asia(O’Donnell, Van Doorslaer et al, WBER, 2007) • Very pro-poor: Hong Kong • Mildly pro-poor: Malaysia, Thailand, Sri Lanka • Mildly pro-rich: Vietnam • Very pro-rich: Bangladesh, Indonesia, India, Gansu, Heilongjiang and Nepal
Two questions • Does public policy fail in low-income countries where poor do not even get their fair (pop) share of public subsidy? Subsidy still narrows rich-poor gap, and poor may benefit more from same subsidy. • Why is public health subsidy more pro-poor in Malaysia, Thailand, Sri Lanka (and Vietnam)? All three emphasize universality, minimize user charges, seek to exempt the poor and spend more. And private sector offering attractive alternative seems to lead to better targeting and redistribution.
Distributions of public and private inpatient care(O’Donnell et al, 2006)
III. Health inequality • Ultimately of greatest concern • Which inequality is inequitable? • Application of rank-based measures such as concentration indices and curves less analogous for health measures, and dependent on measurement scale of health • Welfare basis for income-related health inequality rests on strong assumptions (Bleichrodt & V Doorslaer,2006) • Two issues here: • Reporting heterogeneity • Decomposition analysis
Heterogeneous health reporting? • Socioeconomic gradients in self-reported health often not found in LDC survey data (e.g. LSMS illness questions) • Suspicion of systematic heterogeneity, i.e. at same true but unobserved health, poor report better health • Implicit health scale cutpoints may vary (eg by SES) • Proposed fix: identify any reporting biases (eg by SES) from the evaluation of health vignettes • Then use this information to ‘correct’ health scale cutpoints • And use corrected cutpoints when analyzing individual’s own health (eg with hierarchical ordered probit model)
Example from Asia(taken from Bago d’Uva et al, 2005) • WHO Multi-Country Survey Data for Indonesia, India (Andrah Pradesh) and 3 Chinese provinces • Ratings for 6 health domains • For own health and vignettes Reporting effects by income: are poor more likely to report same condition as very good? Yes in India and China (some domains), not in Indonesia (Fig) Does heterogeneity correction ‘resurrect’ the SE gradients? Yes, for some domains, and some countries. Not for others.
Reporting heterogeneity evidence: rich-poor disparities in China example • Ratio of top to bottom quintile of prob of reporting very good health (on the vignettes): rich have higher expectations
Effect of heterogeneity correction on rich-poor disparities in China example • Ratio of top to bottom quintile of prob of being in very good health(own)
Beyond measurement: decomposition of health inequality In general, for any linear additive explanatory model such as : where y is health, X is a vector of determinants, and eis a disturbance term, one can write (Wagstaff et al, 2003): And in (time) differences:
Example: Child malnutrition in Vietnam 93-98 Decomposing change in CI of haz (Wagstaff et al, 2003)
Lessons from EQUITAP: methods • Egalitarian based equity measurement approaches require some reconsideration in low-income, low-coverage contexts • Payments: focus on income protection rather than redistribution • Health care use: examine redistribution through (public) subsidies in absence of need adjustment • Health: inequality decomposition studies using ‘objective’ indicators need to be complemented with studies using self-reported indicators, after purging any reporting biases • In general, descriptive x-country work on measurement and explanation needs to be complemented with well-controlled evaluation work on distributional impact.
Lessons from EQUITAP: findings • Some countries in Asia achieve far better distributional outcomes than others, even at similar income levels • Unfortunately, it is often the larger countries that perform worse (China, India, Indonesia, …) • What explains relative success of the good examples? (Sri Lanka, Thailand, Malaysia) Income and growth helps, but is not sufficient Targeted protection of worst off also helps Interestingly, a combination of (near) universal public provision, linited user charges and good geographic dispersion of services, coupled with an attractive private alternative sometimes leads to best protection.