PaCO2 equation
PaCO2 equation. Alveolar Ventilation www.mecriticalcare.net. The Key to Blood Gas Interpretation: Four Equations, Three Physiologic Processes. Equation Physiologic Process 1) PaCO2 equation Alveolar ventilation 2) Alveolar gas equation Oxygenation
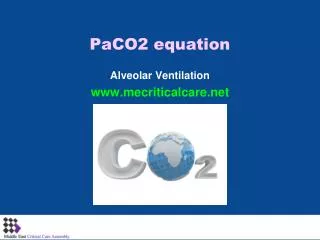

PaCO2 equation
E N D
Presentation Transcript
PaCO2 equation Alveolar Ventilation www.mecriticalcare.net
The Key to Blood Gas Interpretation:Four Equations, Three Physiologic Processes EquationPhysiologic Process 1) PaCO2 equation Alveolar ventilation 2) Alveolar gas equation Oxygenation 3) Oxygen content equation Oxygenation 4) Henderson-Hasselbalch equation Acid-base balance These four equations, crucial to understanding and interpreting arterial blood gas data.
PaCO2 Equation: PaCO2 reflects ratio of metabolic CO2 production to alveolar ventilation VCO2 x 0.863 PaCO2= ---------------------------- VA = VE – VD VCO2 = CO2 production VE = minute (total) ventilation = resp. rate x tidal volume VD = dead space ventilation = resp. rate x dead space volume 0.863 converts VCO2 and VA units to mm Hg
Dead Space High PEEP Alveolus VDA Alveolus Alveoli High PEEP Airways ETT VDequip VDanat
PaCO3 Equation Low Production High Production • Hypothermia • Hyporthyroidism • Underfeeding • Neuromuscular blockade • High fatty acid substrate • Sepsis/inflammation • Hyperthermia • Hyperthyroidism • High carbohydrates • Seizure and agitation Cell Metabolism . VCO2 PaCO2= VE * (1- VD/VT) VDequip HME Respiratory Rate Tidal Volume VDanat VDA PEEP Low BP
Hypercapnia ↑VCO2 ↑PaCO2 = ----------------------- ↔VA = VE – VD • Increased CO2 production but not able to hyperventilate: • Fever • Sepsis • Hyperthyroidism • Overfeeding with carbohydrates • Agitation
Hypercapnia ↔VCO2 ↑PaCO2 = ----------------------- ↓VA = ↓VE – VD • Decreased Alveolar Ventilation due to Decreased Minute Ventilation (VE= ↓VT X ↓RR) • Sedative drug overdose • Respiratory muscle paralysis • Central hypoventilation
Hypercapnia ↔VCO2 ↑PaCO2 = ----------------------- ↓VA = VE– ↑VD • Decreased Alveolar Ventilation due to Increased Dead Space Ventilation (VD= Dead Space Volume X RR) • Pulmonary embolism • High PEEP • Pulmonary hypertension • Chronic obstructive pulmonary disease
Hypocapnia ↓VCO2 ↓PaCO2 = ----------------------- ↔VA = VE – VD • Decreased CO2 production but same minute ventilation: • Hypothermia • Paralysis • Hypothyroidism • Underfeeding with carbohydrates • Sedation
Hypocapnia ↔VCO2 ↓PaCO2 = ----------------------- ↑VA = ↑VE – VD • Increased Alveolar Ventilation due to Increased Minute Ventilation (VE= ↑ VT X ↑RR) • CNS stimulants • Agitation • Central hyperventilation
Eucapnia ↑VCO2 ↔PaCO2 = ----------------------- ↑VA = ↑VE – VD • Increased CO2 production and Increased Alveolar Ventilation: • Fever and sepsis • Hyperthyroidism • Agitation
Eucapnia ↓VCO2 ↔PaCO2 = ----------------------- ↓VA = ↓VE – VD • Decreased CO2 production and decreased Alveolar Ventilation • Hypothermia • Hypothyroidism
PCO2 vs. Alveolar Ventilation The relationship is shown for metabolic carbon dioxide production rates of 200 ml/min and 300 ml/min (curved lines). A fixed decrease in alveolar ventilation (x-axis) in the hypercapnic patient will result in a greater rise in PaCO2 (y-axis) than the same VA change when PaCO2 is low or normal. This graph also shows that if alveolar ventilation is fixed, an increase in carbon dioxide production will result in an increase in PaCO2.
PaCO2 and Alveolar Ventilation: Test Your Understanding VCO2 X 0.863 VCO2=300 X .863 VCO2=259 PaCO2 = ----------------------- PaCO2=71.9 VA = VE – VD VA = 3.6 VA = VE (7.2) – VD (3.6) VA = VE (300X24) – VD (150 X 24) What is the PaCO2 of a patient with respiratory rate 24/min, tidal volume 300 ml, dead space volume 150 ml, CO2 production 300 ml/min? The patient shows some evidence of respiratory distress.
PaCO2 and Alveolar Ventilation: Test Your Understanding VCO2 X 0.863 VCO2=200 X .863 VCO2=173 PaCO2 = ----------------------- PaCO2=38.4 VA = VE – VD VA = 4.5 VA = VE (6) – VD (1.5) VA = VE (600X10) – VD (150 X 10) What is the PaCO2 of a patient with respiratory rate 10/min, tidal volume 600 ml, dead space volume 150 ml, CO2 production 200 ml/min? The patient shows some evidence of respiratory distress
PaCO2 and Alveolar Ventilation: Test Your Understanding ↑300X 0.863 200X 0.863 VCO2 X 0.863 PaCO2 = ----------------------- PaCO2=59.9 PaCO2=40 VA = 4.32 L/min VA = VE – VD A man with severe chronic obstructive pulmonary disease exercises on a treadmill at 3 miles/hr. His rate of CO2 production increases by 50% but he is unable to augment alveolar ventilation. If his resting PaCO2 is 40 mm Hg and resting VCO2 is 200 ml/min, what will be his exercise PaCO2?
Effective Ventilation Alveolus VDA Alveolus Alveoli Airways ETT VDequip VDanat VT= 500 RR= 10 VDequip= 50 VDanat= 125 VDA= 25 VTe= 300 VT= 250 RR= 20 VDequip= 50 VDanat= 125 VDA= 25 VTe= 50 VE= 5 L/min