Download
1 / 30
300 likes | 676 Views
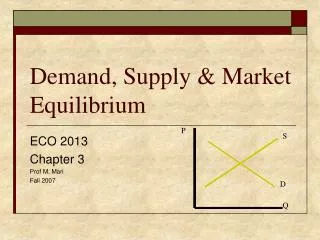
Perfectly Competitive Supply: The Cost Side of the Market. Buyers and Sellers. Buyers “Should I buy another unit?” Answer: If the marginal benefit exceeds the marginal cost Sellers “Should I sell another unit? Answer: If the marginal revenue exceeds the marginal cost of making it.

E N D
Perfectly Competitive Supply: The Cost Side of the Market
Buyers and Sellers • Buyers • “Should I buy another unit?” • Answer: If the marginal benefit exceeds the marginal cost • Sellers • “Should I sell another unit? • Answer: If the marginal revenue exceeds the marginal cost of making it
Upward-Sloping Supply Curves • The Low-Hanging Fruit Principle • Suppliers first use the resources easiest-to-find • So, the price of the output must go up in order to compensate for using harder-to-find resources • I.E., costs tend to rise when producers expand production in the short-run (some inputs are fixed in the short-run)
Profit Maximization • Profit • The difference between the total revenue it receives from the sale of its product minus all costs, explicit and implicit • Note: this includes opportunity cost, and is therefore different than profit in a traditional accounting sense • Profit-maximizing firm • A firm whose primary goal is to maximize profits
Types of Markets One firm = 2-12 firms many firms many, many firms Monopoly Oligopoly Monopolistic Perfect Competition Competition
Firm Decisions to Max Profit • What to produce (what market)? • How much to produce? • What inputs to use? • What price to charge?
Perfect Competition • Perfectly Competitive Market • A market in which no individual supplier has significant influence on the market price of the product • Many firms all selling the same product. Product is “standardized” • A Price taker is a firm that • Has no influence over the price at which it sells its product • Sells only a fraction of the market output • Can sell as much output as it wishes
Perfectly Competitive Firm • Given that there are many firms all selling the exact same product, what does the demand curve for any one firm’s good look like?
Production in the Short Run • Factors of Production • An input used in the production of a good or service • Short Run • A period of time sufficiently short that at least some of the firm’s factors of production are fixed • Long Run • A period of time of sufficient length that all the firm’s factors of production are variable
Law of Diminishing Returns • Fixed factor of production • An input whose quantity cannot be altered in the short run. E.g. square footage of factory space • Variable factor of production • An input whose quantity can be altered in the short run. E.g. labor • Law of Diminishing Returns • If one factor is variable and all others are fixed: the increased production of the good eventually requires ever larger increases in the variable factor
Law of Diminishing Marginal Returns Q Point of diminishing marginal returns Labor MPL
Implications for Marginal Costs • Since productivity (MPL) typically first increases and then decreases (at the point of DMR), what will marginal costs do? • When productivity is rising, marginal costs should be falling. • When productivity is falling, marginal costs should be rising. • Unit costs measures are inversely related to productivity measures
Choosing Output • How much to produce? • The goal is to maximize profit • Profit = TR – TC • A perfectly competitive firm chooses to produce the output level where profit is maximized • Cost-Benefit Principle • A firm should increase output if marginal benefit (revenue) exceeds the marginal cost
Choosing Output • Cost-Benefit Principle • Increase output if marginal benefit exceeds the marginal cost • For a perfectly competitive firm • Marginal benefit = marginal revenue = price • Cost-Benefit Principle for a Price Taker • Keep expanding as long as the price of the product is greater than marginal cost • Choose the output where P = MC
Profit Maximizing Condition • Profit = TR – TC • Max Profit with respect to Q • d Profit / dQ = (dTR/ dQ) – (dTC/dQ) = 0 • therefore maximum profit occurs where MR = MC
Shut Down? • Perfectly competitive firms should produce where MR (P) = MC, unless price is very low • If total revenue falls below variable cost, the best the firm could do is shut down in the short run
Fig. 6.6Price = Marginal Cost: The Perfectly Competitive Firm’s Profit-Maximizing Supply Rule
Perfectly Competitive Firm’s Supply Curve • The perfectly competitive firm’s supply curve is its • Marginal cost curve • At every point along a market supply curve • Price measures what it would cost producers to expand production by one unit
Profit Maximization ATC = Total Cost / Q so, TC = ATC x Q P > ATC means profit > 0 P MC ATC 10 = P* D = MR 8 Q* Quantity 100
Suppose Price Falls to Min ATC P = ATC means profit = 0 P MC ATC 7 = P* D = MR Q* Quantity
Suppose Price Falls below Min ATC P < ATC means profit < 0 P MC ATC 7 = P* D = MR Q* Quantity
Producer Surplus • Producer Surplus (PS) is the difference between the firm’s minimum willingness to accept (MC) and what they actually accept (P), summed over all units produced.
P 30 10 S PS D 20 Quantity Producer Surplus and Supply • Graphically then, PS is the area below the price line and above the supply curve, up to Q* Here, PS = $100 =½(base)(height) = ½(20)(10)
exercises A profit maximizing perfectly competitive firm must decide: A. only on what price to charge, taking output as fixed. B. both what price to charge and how much to produce. C. only on how much to produce, taking price as fixed. D. only on which industry to join, taking price and output as fixed. E. only on how much revenue it wishes to collect.
exercises To produce 150 units of output, the firm must use 3 employee-hours. To produce 300 units of output the firm must use 8 employee-hours. Apparently, the firm is: A. more profitable. B. experiencing diminishing marginal returns. C. in the long run. D. not using any fixed factors of production. E. failing to profit maximize.
exercises • Which of the following factors of production is likely to be fixed in the short run? A. The location of the firm. B. The number of employee-hours. C. The amount of electricity consumed. D. The amount of paper used. E. The amount of RAM installed in the network server. • When the marginal return to the variable factor of production is diminishing, the marginal cost curve is A. upward sloping. B. convex. C. parallel to the vertical axis. D. downward sloping. E. concave.