Download
1 / 42
420 likes | 574 Views
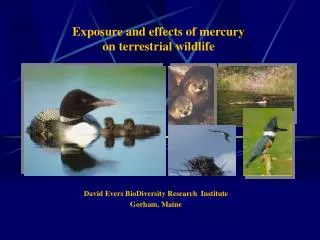
Exposure and effects of mercury on terrestrial wildlife. David Evers BioDiversity Research Institute Gorham, Maine. Presentation Outline. Understanding the where, what, why of biotic Hg Geographic context Factors related to Hg interpretation Developing national monitoring standards

E N D
Exposure and effects of mercury on terrestrial wildlife David Evers BioDiversity Research Institute Gorham, Maine
Presentation Outline • Understanding the where, what, why of biotic Hg • Geographic context • Factors related to Hg interpretation • Developing national monitoring standards • Potential national indicator species • Why use the loon? • Risk Characterization (weight of evidence approach) • Exposure profile results (spatially explicit) • Hazard profile results (individual & population level) • Linking science to policy • WCV Hg Model • Southeastern NH “hotspot” • What’s next? BioDiversity Research Institute
What parts of the country are at greatest risk? BioDiversity Research Institute
Geographic trend of Hg in a standard species: Common Loon (n>2000 individuals)* *Evers et al. 1998, Environ. Tox. Chem.; Evers et al. 2003, Ecotoxicology BioDiversity Research Institute
How is MeHg availability distributed within the Northeast? BioDiversity Research Institute
Sampling Effort: 1992-2003; n>1,800 Evers et al. In Press, Ecotoxicology BioDiversity Research Institute
What do tissues indicate? BioDiversity Research Institute
Fish prey Hg strongly correlates with adult loon blood Hg (r2>0.72)* * Scheuhammer and Blancher 1998, Hydrobiologia; Burgess and Hobson In Press. Hydrobiologia; Evers et al. In Press, Ecotoxicology BioDiversity Research Institute
Loon egg Hg strongly correlates with adult female blood Hg (r2=0.79)* * Evers et al. 2002. Ecotoxicology 12:69-81. BioDiversity Research Institute
Otter and mink fur Hg strongly correlates with brain (and liver) Hg* MINK OTTER * Yates et al. In Press, Ecotoxicology BioDiversity Research Institute
What habitats are at greatest risk to higher trophic level biota? BioDiversity Research Institute
Aquatic systems • Wetlands, particularly bogs • Acidic lakes (<6.3)* • Certain reservoirs (current USDA study) • Urban estuaries (current USFWS study) • Terrestrial systems • Mountaintops~ • Areas deficient in Ca (due to potential synergy) *Meyer et al. 1995, Hydrobiologia ~ Rimmer et al. In Press, Ecotoxicology BioDiversity Research Institute
A A B C Blood Hg levels in juvenile Bald Eagles, Maine Evers et al. In Press, Ecotoxicology BioDiversity Research Institute
Blood Hg levels in adult and juvenile Belted Kingfishers, Maine B B C A Evers et al. In Press, Ecotoxicology BioDiversity Research Institute
Factors confounding interpretation of Hg exposure Age Class Sex Evers et al. In Press, Ecotoxicology BioDiversity Research Institute
Insectivorous songbird blood Hg level comparison BioDiversity Research Institute
Mountains (ug/g, ww)* New England: 0.08-0.27 DR and Cuba: 0.03-0.42 Urban Estuaries~ Blood Hg (ug/g, ww) 5 locations, southern ME NSTS SSTS *Rimmer et al. In Press, Ecotoxicology ~Shriver et al. 2002, MDEP Unpubl. Rept. BioDiversity Research Institute
What is the standard measuring stick? BioDiversity Research Institute
National indicators program* National EPA-directed and cooperative process is currently targeting candidate species, based on (1) available information, (2) geographic representation, (3) at greatest risk, (4) logistical feasibility and (5) most interpretative of site (i.e., predictable feeding area/small home range). Candidate Indicators: Lakes…. Common Loon & Bald Eagle Rivers…. Belted Kingfisher Mountains… Bicknell’s Thrush Wetlands….. Tree Swallow Estuaries….. saltmarsh sparrows (SSTS, NSTS, SESP) Inshore marine areas.. Common Tern Offshore marine areas.. Leach’s Storm-Petrel * Mason et al. In press. Environmental Science and Technology 39 & Wolfe et al. In press. SETAC book. BioDiversity Research Institute
Mink and River Otter as indicators of landscape level risk* Yates et al. In Press, Ecotoxicology BioDiversity Research Institute
The Common Loon as a national indicator: (1) monitoring exposure, (2) determining effects, & (3) relating at a population level BioDiversity Research Institute
Why the Common Loon? • High trophic level obligate piscivore (biomagnification); • “K-selected” life history strategy (bioaccumulation); • Complex and coordinated behaviors within pair; • Moderate to high sensitivity to stressors; • Logistically feasible (easily observed and individually identified over entire breeding period); • Matrices (i.e., blood and eggs) can represent a target area • High profile to public and therefore policymakers; • Demographic models developed based on >3,000 banded loons. • Documented individual and, potentially, population level impacts from MeHg ingestion (based on dosing studies* and long-term field investigations); Meyer et al. per. com. BioDiversity Research Institute
Do current levels cause ecological impact? BioDiversity Research Institute
Rangeley Lakes Focal Study Site(44 lakes with 181 Loon Territories) BioDiversity Research Institute
Hazard Assessment for individuals; Does Hg impact individual loons? YES • Physiological: • Significant relationship with increasing corticosterone & MeHg • Behavioral (>2,500 hours of observation)~ • Higher Hg levels sig. reduce time incubating • Higher Hg levels cause adults to become lethargic (i.e., they spend sig. more time in low energy behaviors) • Pharmacokinetics: • Recaptured adults have 9% (males) and 5.6% (females) annual increase in feather Hg levels+ • Recaptured juveniles have increasing (1-3%/day) Hg levels during the summer *Olson et al. Conservation Ecology ~Nocera and Diamond 1999; Conservation Ecology +Evers et al. 1998, Environ. Tox. Chem. BioDiversity Research Institute
Behavioral impacts • 90% • 80% • R • 2 • = 0.230 • p = 0.037 • 70% • Percent time adults (M&F) spent • 60% • 50% • in High* energybehaviors • 40% • 30% Low Hg incubation time=99% of time High Hg incubation time=85% of time • 20% • 10% • 0% • 0.00 • 1.00 • 2.00 • 3.00 • 4.00 • 5.00 • 6.00 • 7.00 • Blood Hg (ppm, ww) Male foraging time for high Hg risk loons is one-third that of low Hg risk ones BioDiversity Research Institute
Population-level impacts from Hg; Is Hg harming loon populations?Likely • Condition/Fitness: • Measurements indicate a decline related to increasing Hg. • Flight feather asymmetry is significant in Maine’s breeding population – the 3.5% mean may result in 15% less flight efficiency • Recaptured high/xhigh adults show a sig. (p=0.03) body weight decline vs. low/mod (n=21). • Egg weights have a sig. (p=0.02) decline as Hg levels increase* • Reproductive Success:~ • Compared to low risk loon pairs, high risk pairs; • Significantly initiate 7% fewer nests • Significantly hatch 31% fewer eggs • Significantly fledge 40% fewer young *Evers et al. 2003, Ecotoxicology ~Evers et al. 2004, MDEP Unpbl. Rept. BioDiversity Research Institute
Impacts to reproductive success 1.4 • Low Risk (n=30 territories, 149 territory-years ) • Moderate Risk (n=58 territories, 330 territory-years) 1.2 1.22 • High Risk (n=46 territories, 394 territory-years) 1.0 0.99 0.8 0.84 • Loon Productivity Rates 0.76 0.76 0.74 0.71 0.68 0.68 0.6 0.65 0.49 0.4 0.41 0.2 0 • Nest (NP/TP) • Hatch (SY/NP) • Chick Survival (LY/SY) • Overall Productivity (LY/TP) • Productivity Parameters BioDiversity Research Institute
Hazard Assessment - Results NOAEL LOAEL Matrix* Low Mod High Xhigh Reference Fish** 0-0.1 0.1-0.2 0.2-0.4 >0.4 Barr 1986, Burgess and Hobson In Press Eggs 0-0.5 0.5-1.3 1.3-2.0 >2.0 Evers et al. 2003 Blood-J 0-0.1 0.1-0.3 0.3-0.4 >0.4 Meyer et al. 1998*** Blood-A0-1.0 1.0-3.0 3.0-4.0 >4.0 Nocera and Diamond 1999 Feather0-9 9-20 20-30 >30 Thompson 1998 * Total Hg levels in ug/g, blood and eggs are ww and feathers are fw ** Represents 10-15 cm Yellow Perch, ww, whole body analysis ***Applies to 3-5 week old chicks only BioDiversity Research Institute
New England risk characterizationOpportunistic and Random Sampling Design BioDiversity Research Institute
Positive Growth Negative Growth Common Loon Population Model • Model • Demographic parameters mostly known • Needs to be spatially explicit • Will provide a test dose for Hg that is based on: • Wild populations • Population level • Results to date • Lamda = 0.48 fledged young/territorial pair • Validated through NH and VT long-term datasets BioDiversity Research Institute
Linking science to policy BioDiversity Research Institute
What is a WCV? A procedure to estimate surface Hg water levels that will protect the viability of wildlife populations associated with aquatic resources • First developed and used in 1995 for the Great Lakes Water Quality Initiative (GLI) • An independently directed U.S. Congressional request in 1990 for a WCV (as mandated by the Clean Air Act) was developed by the U.S. EPA in a 1997 Report to Congress. • Parts of this report were published by Nichols and Bradbury as “Derivations of wildlife values for mercury” in the J. Toxicology and Environ. Health, 1999. BioDiversity Research Institute
Test Dose • EPA WCV limitations • Test dose is: • Based on mallards, non-piscivorous birds that are more sensitive to Hg toxicity because for evolutionary reasons; • Based on laboratory studies; • Based on impacts to individuals. • Ingestion rates and BAF are quite generic and are not based on empirical data. • BRI WCV (response to limitations in EPA model) • Test dose is: • based on a species that is sensitive to Hg toxicity and is exposed to Hg levels that are significantly higher than historical levels on freshwater lakes; • Based on in-field studies: • Based on impacts to populations. • Ingestion rates and BAF are empirically measured parameters. BioDiversity Research Institute
Bioconcentration Factor • Total Hg in unfiltered water related to yellow perch Hg (whole body, ww) • BAF for Trophic Level 3 fish (5-15 cm) = 86,250 • BAF for Trophic Level 4 fish (15-25 cm) = 156,330 • Total Hg in unfiltered water related to perch or perch equivalents • Best relationship with 5-10 cm size class (explains 55% of variation) • Species-to-species conversion is 1.15 for centrarchids, golden shiner, trout • Water-fish MeHg relationship is being investigated in New York BioDiversity Research Institute
WCV for Hg based on population levels of the Common Loon WCV Male Loon = 0.179 mg/kg/d x [1/3 x 1 x 2)]) x 5.95 kg 0.012 L/d + [(0.73) (1.19 kg/d x 86,250) + (0.27) (1.19 kg/d x 156,330) WCV Male Loon = 1.418 ng/L WCV Female Loon = 0.142 mg/kg/d x [1/3 x 1 x 2)]) x 4.71 kg 0.012 L/d + [(0.83) (0.943 kg/d x 86,250) + (0.17) (0.943 kg/d x 156,330) WCV Female Loon = 1.204 ng/L BioDiversity Research Institute
Where do emission point sources have the greatest impact? BioDiversity Research Institute
Southeastern New Hampshire “hotspot”1. Detected by USEPA atmospheric deposition models2. Likely related to high Hg emissions from local municipal and hospital waste incinerators andcoal-burning power plants 3. Loon tissue Hg results (n=266 samples; 47 lakes)4. Recent assessments show a decline in the biotic Hg signal BioDiversity Research Institute
Much is known….what’s next? • Determine Hg effect levels on wildlife (LOAELs) • Loon emphasis in Northeast (in situ) and Wisconsin (lab/in situ) • Insectivorous bird emphasis in Northeast (in situ) and Patuxent Wildlife Research Center (lab) • Further understand Hg relationships in systems (i.e., reservoirs) that do not follow NSRC models (long-term USDA NSRC grant) • Relate abiotic and biotic Hg levels with exposed shoreline • Further explore biodilution, where plankton structure dictates biomagnification • Investigate the interaction among reservoirs with varying hydrology and chlorophyll A levels BioDiversity Research Institute
Develop spatially-explicit wildlife criterion value (WCV) for Hg • In process for Maine (fourth year) and New York (second year) • Vermont and New Hampshire?? • Summarize Hg databases into a common database, model Hg relationships, and publish results • In process through the USDA’s Northeastern Ecosystem Research Cooperative (NSRC): Special double issue in Ecotoxicology published in early 2005 BioDiversity Research Institute
Collaborators • FEDERAL GOVERNMENT • U.S. Fish and Wildlife Service – New England Field Office and Office of Migratory Bird Mgmt. • U.S. EPA – ORD Narragansett Office – Atlantic Ecological Div. & the New England Field Office • U.S.D.A. – Northeastern Ecosystem Research Cooperative • Canadian Wildlife Service • STATE GOVERNMENT • Maine Dept. of Environ. Protection & Inland Fish and Wildlife • Mass. Dept. Conserv. & Resour. • NH Dept. of Environ. Service • NY State Dept. of Environ. Cons. • Vermont Dept. of Environ. Cons. • NON-PROFIT / UNIVERSITY • Adirondack Coop. Loon Program • Buffalo State College • Loon Preservation Committee • Maine Audubon Society • Texas A&M Trace Element Res. Lab • Tufts University • Univ. of Pennsylvania • Univ. of Southern Maine • Vermont Inst. Of Natural Science • Wildlife Conservation Society • INDUSTRY • FPL Energy Maine Hydro • New York State Energy Research and Development Authority BioDiversity Research Institute