Download
1 / 9
90 likes | 183 Views
Stay updated on CDM project activities, funding opportunities, institutional developments, and common issues. Explore the evolving landscape of proposed projects and the financial resources available for climate initiatives.

E N D
CDM Portfolio update Jane Ellis (OECD) AIXG seminar, 21 March 2005
Outline • Institutional developments • Update on proposed CDM project activities • Status of proposed CDM project activities • Funding for CDM/JI • Common sticking points
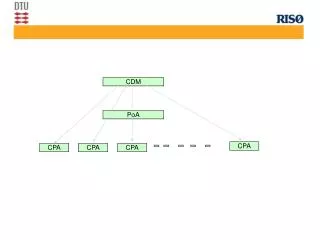
Institutional developments • Growth in Designated National Authorities continuing • 75 DNAs established to date (59 in Non-Annex I Parties, 16 in Annex I Parties/EC) • More baseline/monitoring methodologies approved: • 21 EB-approved methodologies in highly diverse areas • 2 “consolidated” methods: renewable electricity, landfills • 14 small-scale methodologies • … and lots more in the pipeline: • 19 new submissions, 9 submissions not yet examined, 5 in “feedback loop”, a few awaiting input from MP or others • “Unilateral” projects eligible to generate CERs
Proposed CDM project activities • Data based on 284 • proposed projects • in 51 countries (up • from 201 in Nov 04) • Expected mitigation • 69.7 Mt CO2-eq/y • in 2008-2012 and • 119Mt pre-2008 • Does not include • projects withdrawn
Rapidly changing portfolio… • Portfolio (incl. proposed projects) dominated by projects reducing high-GWP waste gases • Some of these projects are very large • (1-10 million credits/year) • Declining importance of • renewables • (21%) • Energy eff. • small • Sinks 4% • Small CCS • project Mar 05, 70 Mt/y Feb 04, 27 Mt/y
Geographical spread uneven • Early dominance by L. America, then Asia • Africa (7%) and AOSIS (3%) small • Handful of countries dominate proposed CDM portfolio: • Korea, 17% of credits (2 projects) • India, 16% of credits (43 projects) • Brazil, 12% of credits (38 projects) • Mexico, 12% of credits (21 projects) • China, 7% of credits (13 projects) • Indonesia, 5% of credits (12 projects) • These countries also received half of FDI flows in 2002
Status of proposed CDM projects • 4 CDM projects registered • (1 landfill gas, 1 small hydro, 2 HFC23 reduction) • 3 further requests for registration under review • 91 projects requesting validation could generate 13.5 Mt CO2-eq/y in 2008-2012 • 53 more projects have submitted their baseline methodology to CDM EB • Approved methods could generate a further 13.5 Mt CO2-eq/y in 2008-2012 (when applied to projects that have not yet requested validation)
Funding available for CDM/JI • US$1.7bn available from several different sources, e.g.: • private, national and international carbon funds, • national JI/CDM programmes, • other government programmes • …mainly public sector, focused on buying credits (rather than funding projects), not all disbursed yet • Does not include investment needed to implement actual projects • Total investment much larger …. but difficult to quantify • World Bank largest player in credit market: >$850m
Common sticking points • Low C price => limited push for CO2 reducing projects • Transaction costs: very variable, but significant, and reduce interest in “smaller” (<50,000 CER/year) projects • No market signal post-2012 • Lead-time for project development much lower for “brownfield projects” • Additionality: difficult to put into practice • Methodology approval can be time-consuming (3 months at best, but can be 6-9 months or longer)