Download

1 / 19
190 likes | 374 Views
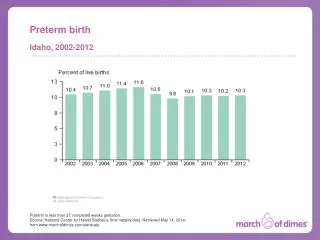
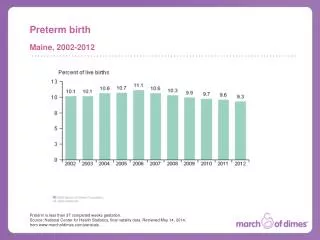
Trends in Preterm Delivery by Race. The Effect of Data Editing Cheng Qin, Patty Dietz, Lucinda England, Joyce Martin, William Callaghan. Data and Study Population. Data: US Natality Files 1990 through 2002

E N D
Trends in Preterm Delivery by Race The Effect of Data Editing Cheng Qin, Patty Dietz, Lucinda England, Joyce Martin, William Callaghan
Data and Study Population • Data: US Natality Files 1990 through 2002 • Study Population: Non-Hispanic White and Non-Hispanic African American singleton live births
Gestational Age Data Editing Methods Applied • Method 1: NCHS • Method 2: Alexander • Method 3: Zhang and Bowes • Method 4: LMP/CE
Alexander et al Method • Gestational age distributions were examined for births grouped into 125-g birth weight intervals • Gestational age values of ± 2.5 SD from the mean (about the first and 99th percentiles) were considered initially as cut points for implausible data • Statistically defined cut points were modified by a week or more in conjunction with clinical consultation • Birth records out of range were deleted
Zhang and Bowes Method • Normal probability plot of birth weight by gestational week • Cutoff point of birth weight selected when a plot from the current data began to deviate from the straight line systematically • Gestational age supplanted by CE for infants whose birth weight was greater than the cutoff point at a given gestational age • Cutoff point for 25 weeks applied to 20-24 weeks; no modification to records >35 weeks • Records with implausible birth weight/gestational age combinations and with missing CE excluded
LMP/CE Method • If NCHS ‘LMP’ and CE are within two weeks each other, use ‘LMP’; otherwise, use CE • Records with missing CE were deleted
Exclusion Criteria • California (no CE) • New Hampshire and Oklahoma from 1990 (no Hispanic) • Missing birthweight (0.1%) • Missing gestational age (0.3%) • Gestational age less than 20 weeks (0.03% in 2001)
Analysis • Percent of records excluded and substituted by different methods and the effect of data editing on bimodal distribution • PTD rates by race and methods 1990 through 2002 • Percent changes over time by methods and by gestational age stratum
Birthweight by Gestational Age Distribution 25-33 weeks – All Race Singleton Live Births, US 2001
Percent of Records Excluded and Replaced by Methods, All Gestation, 1990 and 2002 NH white NH A-A NH white NH A-A 1990 2002
Percent of Records Excluded and Substituted by Methods, GA Groups– NH A-A 2002 20-27 wks 28-31 wks 32-36 wks
Birthweight Distribution 20-27 Weeks by Data Editing Methods, US NH white and NH A-A Singleton Live Births, 2001
Birthweight Distribution 28-31 Weeks by Data Editing Methods, US NH white and NH A-A Singleton Live Births, 2001
Birthweight Distribution 32-35 Weeks by Data Editing Methods, US NH white and NH A-A Singleton Live Births, 2001
Trend of PTD (<37 weeks) by Data Editing, Singleton Live Births for US NH white and NH A-A, 1990-2001
Percent Change of Preterm Delivery (<37 Weeks) NH white NH A-A
Summary • Bimodal distribution in early gestation weeks; disappeared when LMP/CE method was applied • Fixed second mode peaked around 3000 grams • Percent records excluded and replaced declined over time regardless of methods • PTD rates increased for NH whites regardless of the methods used • PTD rates slightly increased for NH A-A by LMP/CE, decreased by other methods